
17 Little-Known Page Speed Hacks That Instantly Improve Load Time
The basic advice is everywhere: compress images, add a CDN, minify JS. You already know that. This is the next level — seventeen underused, precision-targeted techniques that can move your Core Web Vitals scores inside a single CrUX cycle, with the real numbers behind each one.
I’ll be straight with you about something uncomfortable. For most of last year I was running page speed audits and recommending the same tired checklist: WebP images, defer scripts, use a CDN, enable Gzip. Sites would improve. Scores would tick up. And then they’d plateau.
The plateau happens because everyone is doing the same basic things now. Lighthouse scores of 75–85 are essentially the baseline for any competent site in 2026. The gains still available — the ones that separate a 78 from a 96, or that move you from “Needs Improvement” to “Good” on real CrUX field data — come from a different tier of techniques entirely.
This article is about that second tier. Some of these hacks have been technically possible for two or three years but remain underused because the documentation is thin, the behavior is counterintuitive, or — my favorite — because popular advice has it completely backwards.
One critical note before we start: Google’s March 2026 core update tightened the LCP “Good” threshold from 2.5 seconds to 2.0 seconds. Sites sitting between 2.0s and 2.5s LCP — who thought they were fine — just fell into “Needs Improvement.” If that’s you, several of the hacks below are specifically for this gap.
Sources: DebugBear, NitroPack, Google web.dev, upwardengine.com; ranges reflect real-site measurements, not controlled lab conditions.
103 Early Hints — Stealing Back Server Think-Time
Every time a browser makes a page request, there’s a dead interval between “server receives request” and “server starts sending HTML.” This is server think-time — database queries, template rendering, auth checks. During all of it, the browser sits idle.
103 Early Hints kills that idle time. It’s an HTTP status code your server sends before the final 200 response is ready. The 103 response contains Link headers telling the browser to preload or preconnect to resources it’s definitely going to need. The browser acts on these immediately, in parallel with the server finishing the response.
<!-- Server sends this BEFORE the full HTML is ready -->HTTP/2 103 Early HintsLink: </css/critical.css>; rel=preload; as=styleLink: <https://cdn.example.com>; rel=preconnectLink: </img/hero.avif>; rel=preload; as=image; fetchpriority=highHTTP/2 200 OKContent-Type: text/html...rest of your page...
Impact on LCP: 100–500ms improvement, depending on how long your server think-time actually is. Shopify found Early Hints made LCP 500ms faster for their merchants when used to preload fonts. Cloudflare, Fastly, and Vercel all support it natively.
The critical detail: only preload and preconnect work reliably in 103 responses. Other hint types work better as HTML elements. Don’t 103-hint your analytics domain; it wastes connection budget on a non-critical resource.
fetchpriority=”high” — The One-Line LCP Fix You Might Be Missing
This is the highest ROI single-attribute change in performance optimization right now. Not a guess — DebugBear ran page speed experiments and found adding fetchpriority="high" to an LCP image made a page load almost a full second faster, with the LCP image request starting significantly earlier in the waterfall and completing over 200ms faster.
<!-- Before: browser doesn't know this is the LCP element --><img src="/hero.avif" alt="Hero" width="1200" height="630"><!-- After: browser immediately prioritizes this fetch --><img src="/hero.avif" alt="Hero" width="1200" height="630" fetchpriority="high" decoding="async">
Why does it work? Browsers make priority guesses about resources. Your hero image is in the HTML, but the browser doesn’t know it will be the LCP element until it parses the CSS and layout. fetchpriority="high" is you cutting the queue explicitly.
If your LCP element changes significantly between users (e.g., A/B tested hero images), fetchpriority on one element can confuse Chrome’s LCP detection and make it unreliable. Only apply where the LCP candidate is consistent. If in doubt, check your CrUX data first.
Also pair this with a matching <link rel="preload"> in <head>:
<link rel="preload" as="image" href="/hero.avif" type="image/avif" fetchpriority="high">
The Speculation Rules API — Navigation That Feels Instant
The old <link rel="prerender"> is dead. Chrome deprecated it. In its place is the Speculation Rules API, and it’s genuinely something different: a JSON-based specification for telling Chrome which pages to pre-render based on user behavior signals, executed at the browser’s discretion using idle resources.
When a user navigates to a pre-rendered page, the LCP is effectively zero from the user’s perspective. The page is already in memory.
<script type="speculationrules">{ "prerender": [ { "source": "list", "urls": ["/pricing", "/features", "/contact"] } ], "prefetch": [ { "source": "document", "where": { "href_matches": "/blog/*" }, "eagerness": "moderate" } ]}</script> The eagerness setting is important. "conservative" only pre-renders when the user shows clear intent (hovering over a link). "moderate" begins on hover. "eager" fires on link visibility. On mobile data connections, respect the Network Information API and don’t use eager speculative loading — you’re eating your users’ data plans.
Early adopters of Speculation Rules reported 15–25% engagement increases from the reduction in perceived navigation latency.
Sources: shortpixel.com, crystallize.com, speedvitals.com, imagepulser.com. Photographic images at equivalent perceptual quality. Results vary by image type.
AVIF for Hero Images, WebP for Everything Else — The Split Strategy
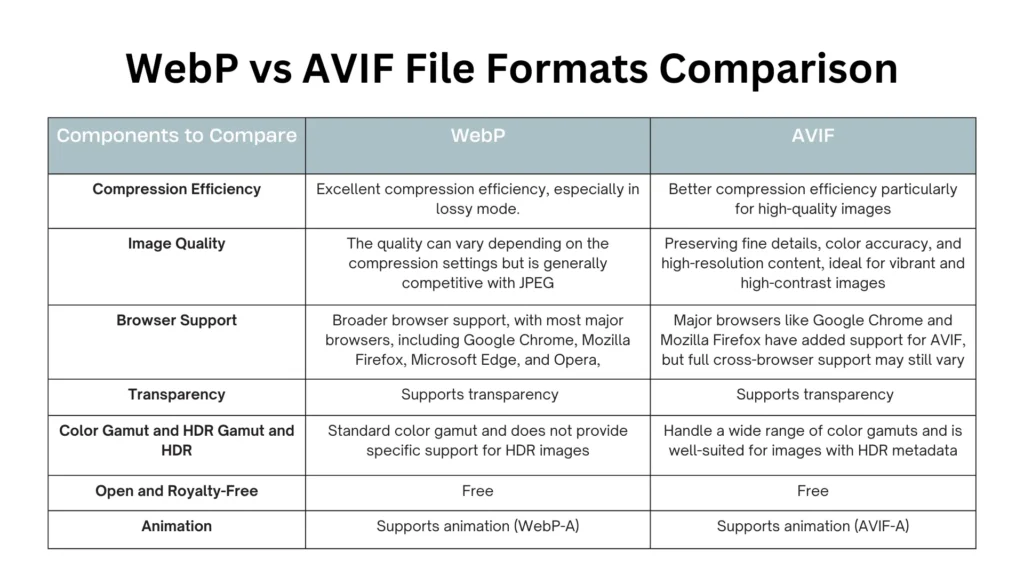
The WebP vs. AVIF debate has a clear answer, and it’s not what either camp’s most vocal advocates claim. Use both, strategically split by use case.
AVIF files are typically 50% smaller than JPEG and 20–30% smaller than WebP at equivalent perceptual quality. For photographic hero images — which are the LCP element on 73% of mobile pages — smaller file size directly and measurably improves LCP. AVIF is the right call for these.
But AVIF encodes significantly slower than WebP, older Android devices decode AVIF more slowly (which can hurt LCP on budget hardware), and AVIF offers minimal advantage for non-photographic assets like icons, illustrations, and UI elements. WebP is faster to encode, faster to decode on budget hardware, and handles lossless compression for logos and icons better.
<!-- The correct pattern: AVIF first, WebP fallback, JPEG last resort --><picture> <source srcset="/hero.avif" type="image/avif"> <source srcset="/hero.webp" type="image/webp"> <img src="/hero.jpg" alt="Hero" width="1200" height="630" fetchpriority="high" decoding="async"></picture>
If you’re on Next.js, the <Image> component handles AVIF/WebP negotiation automatically. On WordPress, plugins like ShortPixel or Imagify do this at conversion time. WordPress 6.5+ supports AVIF natively in the media library.
Font Subsetting Surgery — Cut Up to 76% of Your Font Weight
Web fonts are often the silent LCP killer. The complete Montserrat font family includes every language variant, every diacritic, every mathematical symbol you will never use. You’re shipping characters for languages your site doesn’t serve, to browsers that will never render them.
Subsetting to only the characters actually used on your site can reduce font file size by up to 76%. A documented real-world example: reducing Montserrat to essential Latin characters dropped its size from 64.6KB to 15KB.
<!-- The right font loading setup --><link rel="preload" href="/fonts/body-subset.woff2" as="font" type="font/woff2" crossorigin><style> @font-face { font-family: 'BodyFont'; src: url('/fonts/body-subset.woff2') format('woff2'); font-display: swap; unicode-range: U+0020-007F, U+00C0-00FF; /* Latin + Latin Extended-A */ }</style> Tools: Font Squirrel Webfont Generator for manual subsetting, Glyphhanger for automated per-page analysis. WOFF2 format alone gives you an additional ~30% reduction over WOFF — in 2026, there is no reason to serve anything other than WOFF2 to modern browsers.
Ranges based on real-site measurements from WebPageTest audits and NitroPack research. Actual impact varies by CDN and server configuration.
Critical CSS Inline + Async Full Stylesheet — Eliminate Render-Blocking
The 2025 Web Almanac found that 85% of mobile pages still fail the render-blocking resources audit. That means your competitors almost certainly have this problem too. Fixing it puts you ahead of most of the market with a single technique.
The concept: extract only the CSS needed to paint above-the-fold content (~5–20KB), inline it in <head>, and load the rest of your stylesheet asynchronously. The browser can render the initial visible view without waiting for a network round-trip.
<head> <!-- 1. Inline only above-fold styles --> <style> /* Critical CSS here — nav, hero, first paragraph */ body { font-family: system-ui; margin: 0; } .hero { background: #0f0f0f; ... } </style> <!-- 2. Load full stylesheet asynchronously --> <link rel="preload" href="/css/full.css" as="style" onload="this.onload=null;this.rel='stylesheet'"> <noscript><link rel="stylesheet" href="/css/full.css"></noscript></head> CSS optimization improves LCP scores by 25–35% in well-documented cases. The important limit: don’t inline more than ~14KB of CSS. Beyond that, you lose the benefit of browser caching for the full stylesheet, and the HTML document becomes bloated enough to require additional TCP packets.
Tools: the critical npm package, WP Rocket for WordPress, or Cloudflare’s Rocket Loader. All automate extraction.
Brotli Level 11 for Static Assets — The Compression Algorithm Upgrade
Gzip is the 1992 algorithm still doing most of the web’s compression work. Brotli, released by Google in 2015, produces text files that are consistently 15–30% smaller than Gzip for the same content. For static assets (CSS, JS, HTML, fonts), the compression trade-off is unambiguous: use Brotli.
| Metric | Gzip (Level 6) | Brotli (Level 11) |
|---|---|---|
| Reduction vs uncompressed JS | ~65% | ~70% |
| Reduction vs uncompressed CSS | ~60% | ~75% |
| Compression speed (server-side) | Fast (good for dynamic content) | Slower (pre-compress static files) |
| Decompression speed (browser) | Fast | Comparable or faster |
| Browser support (2026) | ~100% | ~96% (all modern browsers) |
The deployment pattern that works: pre-compress all static assets to Brotli level 11 at build time. Serve them with Content-Encoding: br. Keep Gzip as a fallback for the minority of browsers that don’t support Brotli (older IE, some bots). Don’t use level 11 for dynamic content — the compression time is too high. Use level 4–6 for dynamic responses if you compress them at all.
Self-Host Your Fonts (And Do It Properly)
Using Google Fonts via CDN is the default. It’s also leaving free performance on the table. Every Google Fonts request requires a DNS lookup to fonts.googleapis.com, then a connection to fonts.gstatic.com, then the font file itself. That’s a minimum of two extra network round-trips before your text renders.
Self-hosting eliminates the cross-origin connection penalty entirely. Self-hosting your fonts, combined with proper subsetting and font-display: swap, reduces font-related delays by 50–200ms.
<!-- Don't do this --><link href="https://fonts.googleapis.com/css2?family=Playfair+Display:wght@700&display=swap" rel="stylesheet"><!-- Do this instead --><link rel="preload" href="/fonts/playfair-display-700-subset.woff2" as="font" type="font/woff2" crossorigin><style> @font-face { font-family: 'Playfair Display'; font-style: normal; font-weight: 700; font-display: swap; src: url('/fonts/playfair-display-700-subset.woff2') format('woff2'); }</style> If you’re on Next.js, the next/font package does this automatically — it self-hosts Google Fonts at build time, generates optimal fallback metrics, and applies font-display: swap. Zero CLS from font loading, zero cross-origin requests.
“The performance bugs hiding in your site aren’t always where Lighthouse says they are. Sometimes the biggest issue is the thing that looks fine — until you look at your 75th-percentile CrUX data on 4G mobile.” — A principle every real performance audit eventually teaches
UTM Parameter Cache Poisoning — The Marketing Team’s Invisible Speed Tax
This one actively angers me, because I’ve seen it tank the performance of otherwise well-optimized sites and nobody noticed for months.
Your marketing team runs a campaign with URLs like /landing?utm_source=email&utm_campaign=spring2026. Your CDN sees a URL it hasn’t cached before. It fetches from origin. Every single UTM variant is treated as a unique page — even though the content is identical. Your cache hit rate for campaign traffic is zero.
The fix: configure your CDN to normalize URL parameters — specifically, to ignore utm_*, fbclid, gclid, msclkid, and other tracking parameters when constructing cache keys.
On Cloudflare, this is a Cache Rule with “Ignore query string parameters.” On Fastly, it’s configuring your VCL to strip tracking params from the cache lookup key before passing them through to the backend.
Strip UTM params from the cache key only — not from the URL the user sees, and not from what reaches your analytics backend. Your GA4 attribution depends on them passing through. You’re telling the cache “these don’t affect content” while still logging them downstream.
The Progressive JPEG Trap — Why “Better Perceived Performance” Can Wreck Your LCP
Progressive JPEGs seem brilliant in theory: the browser shows a blurry preview immediately, then sharpens as more data arrives. Users see something fast. But for Core Web Vitals, this is actively harmful.
LCP measures when the element finishes loading — not when it becomes visible. A progressive JPEG that shows a blurry preview at 100ms but doesn’t finish rendering until 1,800ms has an LCP of 1,800ms. A baseline (non-progressive) JPEG of the same file size might finish at 900ms.
This is the kind of optimization that feels right, does well in user testing (“people see something faster!”), and simultaneously destroys your CrUX scores. The lesson: for your LCP element specifically, prioritize time-to-completion over time-to-first-pixel. Use baseline JPEGs, or better, WebP/AVIF which don’t have this issue in the same way.
Framework based on Google web.dev INP documentation and Chrome DevTools performance profiling patterns.
yield to Main — Breaking Long Tasks to Fix INP
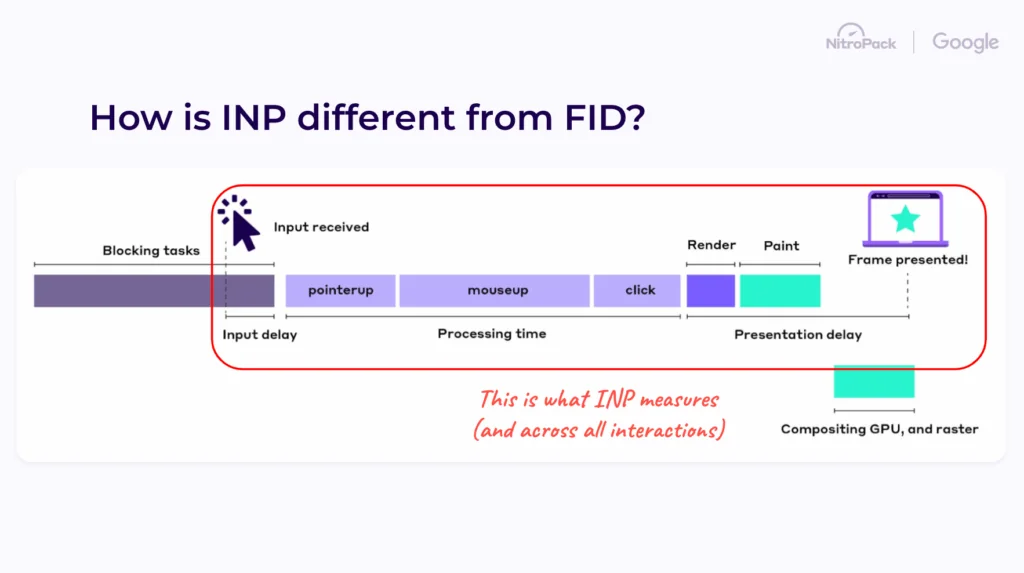
INP became an equal ranking signal alongside LCP in March 2026. Sites with INP above 200ms saw average ranking drops of ~0.8 positions in the March update fallout. If your site feels sluggish when users interact — clicks that take a moment to register, filters that make the UI stutter — this is why.
The root cause is almost always the same: JavaScript long tasks blocking the main thread. The browser can’t process user interactions while it’s executing JavaScript. The fix isn’t necessarily writing less JS — it’s breaking large tasks into smaller ones so the browser can render between them.
// BEFORE: One long synchronous taskfunction processLargeDataset(items) { items.forEach(item => { // heavy computation — blocks main thread transformItem(item); renderItem(item); });}// AFTER: yield to main between chunksasync function processLargeDataset(items) { const CHUNK_SIZE = 50; for (let i = 0; i < items.length; i += CHUNK_SIZE) { const chunk = items.slice(i, i + CHUNK_SIZE); chunk.forEach(item => { transformItem(item); renderItem(item); }); // Yield: let browser handle interactions before next chunk await new Promise(resolve => setTimeout(resolve, 0)); }} In React, the equivalent is useTransition and startTransition for wrapping non-urgent state updates. These tell React “this update can wait if there’s user interaction to handle,” which directly protects INP.
Accidental LCP — The Element You Didn’t Know Was Your Bottleneck
This one is underdiagnosed and responsible for more unexplained LCP scores than people realize. “Accidental LCP” is when the browser identifies something as the Largest Contentful Paint element that you didn’t intend and didn’t optimize.
A documented real-world case from early 2026: an e-commerce category page had a lazy-loaded product thumbnail becoming the LCP candidate because there was no descriptive text above the fold. The fix wasn’t image optimization — it was adding a text headline above the fold, which became the new LCP element and was already painted instantly.
How to check: open Chrome DevTools, run Lighthouse, and look at the “LCP Element” highlighted in the audit. Then ask: is this the element I intended? Is it above the fold? Is it the actual first thing users see? If not, the optimization target is the page structure, not the asset itself.
In Chrome DevTools Performance panel, record a page load, then look for the “LCP” marker. The element callout will show exactly what Chrome identified. Cross-reference with your PageSpeed Insights “LCP Element” field — they should match. If they show different elements, you have a consistency problem that affects your CrUX field data.
HTTP/2 Prioritization Verification — The Configuration No One Checks
You’ve set up HTTP/2. You’ve added resource hints. You’ve configured fetchpriority. And your server is ignoring all of it — because HTTP/2 multiplexing without correct server-side prioritization sends low-priority resources at the same time as critical page content.
DebugBear’s analysis showed that checking and correcting HTTP/2 server prioritization improved LCP by over 200ms in tested scenarios. The fix is verifying that your server actually respects the browser’s priority signals.
How to check: use WebPageTest with “Connection View” enabled, or check the “Priority” column in Chrome DevTools Network tab. Critical resources (your HTML, LCP image, critical CSS) should show “Highest” priority and start downloading before lower-priority resources complete. If they don’t, your server’s HTTP/2 implementation needs configuration work.
Nginx, Apache, and most CDN configurations can be tuned for this. Cloudflare handles it by default; self-hosted Nginx needs the http2_push_preload setting reviewed.
Estimates based on NitroPack 2026 analysis, ALM Corp research, and Google CrUX aggregate data. LCP figure reflects post-March 2026 threshold tightening.
Skeleton Screens vs. Lazy Loading Choreography — Perceived Performance Mastery
There’s a perception-versus-measurement split in page speed that most guides don’t address directly. CrUX field data measures what browsers record. But users feel page speed in a different way — and perceived performance is its own engineering discipline.
Skeleton screens — placeholder outlines that match the layout of content before it loads — reduce perceived wait time by giving users a structural preview. Research in performance-driven design shows that a site targeting under 1 second of perceived load time can use skeleton screens to achieve this even when the actual LCP is 1.8 seconds.
The choreography principle: never make users stare at a blank white screen. The sequence should be: skeleton → actual content structure → full image/font load. Each transition should feel intentional, not glitchy.
Combine this with lazy loading choreography: every image below the fold gets loading="lazy". Every image above the fold gets fetchpriority="high" or explicit preload. The LCP image never — under any circumstance — gets loading="lazy".
<!-- Never do this to your LCP image --><img src="/hero.avif" loading="lazy" alt="Hero"> <!-- ❌ --><!-- Do this --><img src="/hero.avif" fetchpriority="high" decoding="async" alt="Hero" width="1200" height="630"> <!-- ✅ --><!-- Everything below the fold --><img src="/product.webp" loading="lazy" decoding="async" alt="Product" width="400" height="400"> <!-- ✅ -->
Third-Party Script Surgery — Auditing the Scripts That Are Eating Your Budget
Most sites with performance problems aren’t slow because of their own code. They’re slow because of third-party scripts: analytics, live chat, social embeds, A/B testing tools, heat mapping, ad trackers. Each one adds 100–500ms to your load time. A typical medium-sized business site carries 8–12 of them.
The surgical approach starts with a measurement-first audit using Request Map or WebPageTest’s “Third-Party Summary” to see exactly which domains are loading and what they cost in blocking time. Then:
- Remove anything not actively used or monitored. That heatmap tool you set up two years ago and never check? Gone.
- Defer everything that doesn’t need to run before first interaction. Analytics, CRM tracking, marketing pixels — none of these need to block your render. Add
deferor load them after a user interaction event. - Facade pattern for heavy embeds: replace YouTube iframes with a static thumbnail + play button. Only load the actual embed when clicked. This alone can save 400–800ms on pages with video.
A/B testing scripts — Optimizely, VWO, and similar tools — are almost always implemented synchronously in the <head> because they need to modify the page before render to avoid flicker. This is an architectural contradiction with good Core Web Vitals. If you’re serious about performance, you need to either find a server-side implementation for A/B tests or accept that your CWV will suffer on tested pages. There’s no elegant client-side A/B testing solution that doesn’t cost LCP points.
size-adjust Font Fallback Engineering — Eliminating CLS Without Sacrifice
CLS from font loading is one of the most persistent layout-shift sources, and it has an underused fix that most developers don’t know exists: size-adjust, ascent-override, and descent-override in @font-face declarations for your fallback fonts.
The problem: your custom font displays at a slightly different size than your system font fallback. When the custom font loads, everything shifts. font-display: swap prevents invisible text but doesn’t prevent the shift. These CSS properties let you adjust the fallback font metrics to match your custom font as closely as possible.
/* Engineering the fallback to match your custom font */@font-face { font-family: 'BodyFontFallback'; src: local('Georgia'); /* or system-ui, Arial */ size-adjust: 98.5%; /* Scale to match custom font */ ascent-override: 95%; /* Adjust cap height */ descent-override: 22%; /* Adjust descenders */ line-gap-override: 0%;}body { font-family: 'BodyFont', 'BodyFontFallback', serif;} Next.js next/font does this automatically, generating optimal fallback metrics at build time. For everyone else, the tool Screenspan Fallback Font Generator takes your custom font and outputs the correct override values. This technique can drive your CLS score from 0.15 to under 0.05 from font loading alone.
Performance Budget in CI/CD — The Only Optimization That Lasts
Here is the thing nobody tells you about page speed work: the half-life of your optimizations is roughly six months. Features get added. New scripts creep in. Someone updates a plugin. A designer adds a beautiful full-bleed image without dimensions. Without a mechanism to catch regressions automatically, every optimization you make today will gradually degrade.
A performance budget in CI/CD is the answer. Set measurable limits on LCP, INP, total JS bundle size, and number of render-blocking resources. Any deployment that breaks these limits fails the build before it reaches production.
# .github/workflows/performance.yml (example)- name: Run Lighthouse CI uses: treosh/lighthouse-ci-action@v10 with: urls: | https://staging.yoursite.com/ https://staging.yoursite.com/blog/ budgetPath: ./budget.json uploadArtifacts: true# budget.json[ { "path": "/*", "timings": [ { "metric": "largest-contentful-paint", "budget": 2000 }, { "metric": "total-blocking-time", "budget": 200 } ], "resourceSizes": [ { "resourceType": "script", "budget": 300 }, { "resourceType": "total", "budget": 1000 } ] }] Tools: Lighthouse CI (open source, integrates with GitHub Actions), DebugBear (commercial, excellent RUM + synthetic combined monitoring), Calibre (commercial, strong team workflow features).
The Framework Most People Are Missing: ROI Stack-Ranking Your Hacks
You can’t implement all seventeen of these at once. Even if you could, you’d want to start with the highest-impact, lowest-effort ones. Here’s an honest attempt at ROI stack-ranking based on effort vs. impact, for a typical CMS-based site in 2026:
Qualitative assessment based on implementation complexity and real-site impact ranges documented in this article.
The implementation order I’d recommend for most sites:
- Week 1:
fetchpriority="high"on LCP image, self-host fonts, enable Brotli. All under an hour of work each. All verifiable in the next CrUX cycle. - Week 2: Convert hero images to AVIF with WebP fallback. Audit and defer third-party scripts.
- Week 3: Inline critical CSS. Implement font subsetting and
size-adjustfallbacks. - Month 2: 103 Early Hints (requires server/CDN support). Performance budget in CI/CD.
- When ready: Speculation Rules API (Chrome-only in 2026; evaluate reach vs. impact for your audience).
The Uncomfortable Truth About Lighthouse Scores
Here is the thing I’d argue with anyone about: Lighthouse scores are not Core Web Vitals scores.
Lighthouse runs in a controlled lab environment — simulated throttled mobile, consistent hardware, predictable conditions. Your CrUX data is real users: their devices, their networks, their browser extensions, their RAM constraints, their slow 4G connection at a train station.
A site with a Lighthouse score of 94 and a CrUX LCP of 3.1s is not a paradox. It’s very common. The Lighthouse score reflects a best-case scenario; the CrUX data reflects your 75th percentile actual user. Optimizing for Lighthouse without monitoring CrUX field data is optimizing the wrong thing.
Lab data tells you what can happen. Field data tells you what is happening. Only one of them affects your rankings. — Core performance audit principle
Google uses a 28-day rolling window of CrUX data to evaluate your Core Web Vitals status. That means improvements you make today won’t fully appear in Search Console for four to six weeks. It also means regressions don’t fully appear for four to six weeks — which is why performance budgets in CI/CD (Hack 17) are so important. You can’t afford to wait a month to discover a problem.
Internal Diagnostics: Where to Start on Your Site Right Now
Before you implement any of the hacks above, run this sequence:
- Google Search Console → Experience → Core Web Vitals. This shows your actual field data status. Look at which metric has the most “Poor” URLs and which URLs are involved.
- PageSpeed Insights on the specific failing URLs. Focus on “Opportunities” and “Diagnostics,” not the overall score. The score is a Lighthouse lab score; the opportunities are field-data-informed.
- Identify your LCP element (highlighted in Lighthouse output). Is it what you expected? Is it correctly prioritized?
- Chrome DevTools Network tab with throttling enabled. Set to “Fast 4G” and watch the waterfall. What loads first? What’s blocking?
- Third-party audit with WebPageTest. Enable “Include third-party resources” in the waterfall and calculate what percentage of your load time is from scripts you don’t own.
The answer to where you should start is almost always in this diagnostic sequence. The sites that see the fastest improvements aren’t the ones that implement the most techniques — they’re the ones that correctly identify the specific bottleneck and hit it precisely.
The March 2026 Google core update tightened LCP thresholds and elevated INP to equal ranking status. If you’re reading this and haven’t checked your Search Console since before March 2026, do that before anything else. Some sites saw ranking drops of 2–4 positions on competitive queries without changing anything — purely because the goalposts moved. Your first job is to know where you actually stand.
Frequently Asked Questions
What is the single biggest page speed hack for LCP in 2026?
Adding fetchpriority="high" to your LCP image is the highest-ROI single-line fix available. It reliably cuts LCP by 200–800ms with zero risk, and is now supported across all modern browsers. If you do nothing else from this article, do that.
Does 103 Early Hints actually help with page speed?
Yes, meaningfully. It reclaims server think-time — the idle interval between a browser making a request and your server beginning to respond. During that time, the browser can preload critical resources instead of waiting. Impact on LCP: typically 100–500ms.
Should I use AVIF or WebP in 2026?
Use AVIF for photographic hero images (LCP candidates) where the ~50% smaller file size versus JPEG gives a measurable LCP advantage. Use WebP as the fallback and for non-photographic UI elements, icons, and illustrations where WebP’s faster encoding and better lossless handling make it the smarter choice.
Did Google change the LCP threshold in 2026?
Yes. The March 2026 core update tightened the “Good” LCP threshold from 2.5 seconds to 2.0 seconds. Sites between 2.0s and 2.5s now fall into “Needs Improvement.” INP was simultaneously elevated to an equal ranking signal alongside LCP and CLS.
How long before Core Web Vitals improvements appear in Search Console?
Google uses a 28-day rolling window of CrUX field data. Improvements take roughly four to six weeks to fully register in Search Console after implementation. This is exactly why performance budgets in CI/CD (Hack 17) are essential — you can’t wait a month to catch regressions.