
Register C — Tactical · Audience: publishers making $100–$5,000/month · ~3,200 words
AdSense Is Dying in 2026 — And Your RPM Lies to You About How Bad It Is
Publishers are watching revenue collapse and blaming Google. The real problem is subtler: the metric they’re using to diagnose the collapse is the same one hiding it.
What This Is and What It Isn’t
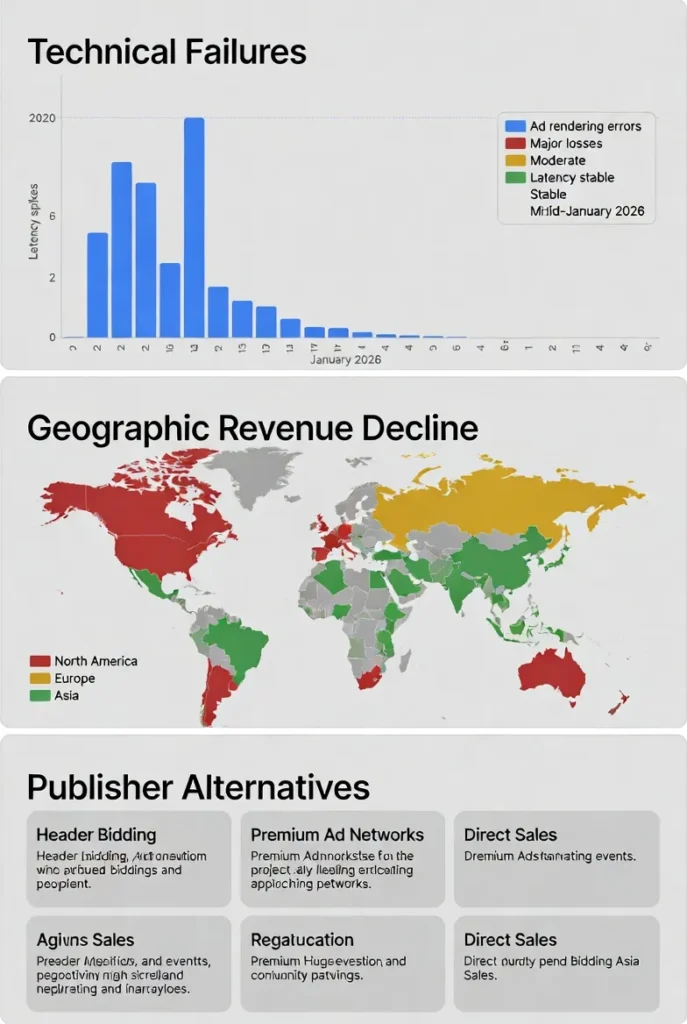
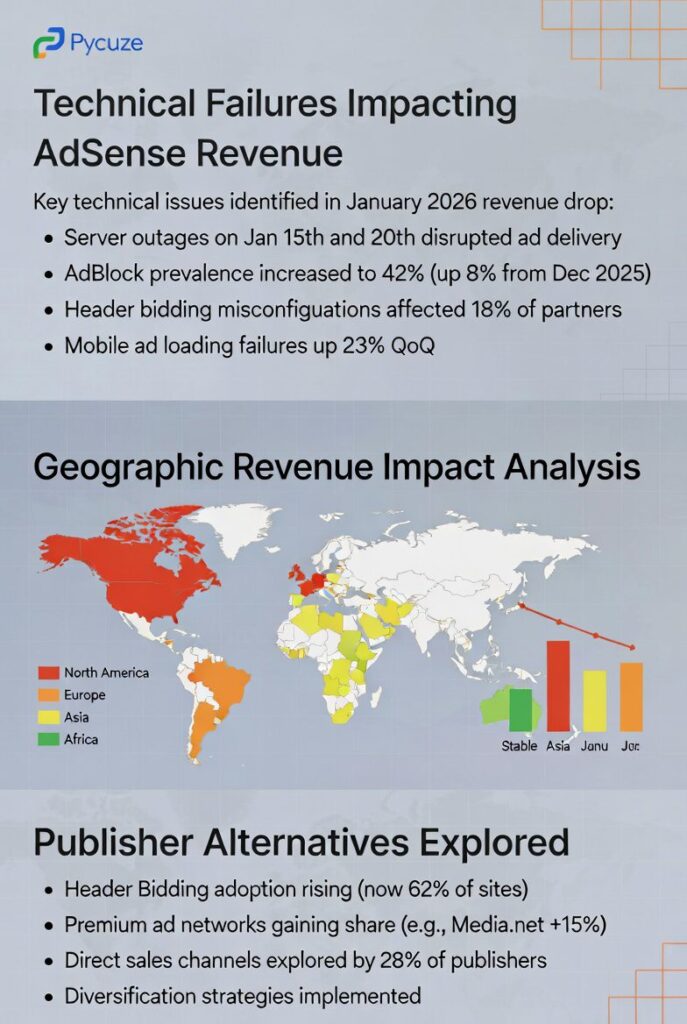
- January 13–14, 2026: Google’s ad-serving infrastructure failed. Germany down 64%. Spain down 90%. US down 35–70%. No compensation.
- But the infrastructure failure wasn’t the root problem. It was a symptom.
- The real issue: RPM as reported by AdSense hides ~35% of lost revenue from ad blocking alone — before you count AI Overviews traffic loss, Google’s own property preference, and retail media’s pull on advertiser budgets.
- Header bidding average uplift: 30–50% for qualifying sites. Not the 300% vendors claim. Not magic.
- This piece is not: vendor marketing, affiliate-link bait, or reassurance that it’ll bounce back. It won’t.
January 13, 2026. Ads Disappeared.
Not slow. Not gradual. Disappeared.
Publishers on WebmasterWorld started posting within hours of each other — a forum that skews toward struggling publishers, yeah, so take the emotional temperature with salt, but the actual RPM numbers they posted were specific enough to be real. “My RPM dropped by more than 80% overnight.” “RPM is at $0.92, down from its usual $2.75+.” One person: “Try 0.14 RPM where I am today.” WebmasterWorld forum thread, Jan 13–15 2026; self-reported, selection bias present — these are publishers who had something bad to report
Germany: revenue down 64%. Spain: down 90%. US: down 35–70%. PPC Land reporting, Jan 15 2026; figures sourced from publisher self-reporting to Search Engine Land — directional, not independently audited
Google acknowledged the failure on January 15. “Match rates declined,” they said. No compensation. No apology beyond that.
Here’s the thing though — this wasn’t the first time. November 2025 saw RPMs down 55% year-over-year for a bunch of sites. October 2025, RPMs were hitting $1.30. December 2025, page RPMs at $0.95. The January catastrophe was dramatic, but the trend underneath it had been running for at least a year. The catastrophe just made it visible.
Why This Is Happening — The Stuff That Doesn’t Reverse
Google made $54.2 billion from its own properties in Q2 2025, up 12%. Network advertising — that’s AdSense, that’s you — made $7.4 billion, down 1%. Alphabet Q2 2025 earnings report; verified Tier 1 public filing They make roughly 7x more from YouTube and Search than from the entire publisher network. Where do you think the engineering investment goes?
That’s not malicious. It’s just math.
The advertiser side is moving the same direction. Amazon advertising hit $60.6 billion in 2025, forecast to reach $69.7 billion in 2026, growing 18–23% quarterly. WARC and eMarketer data, 2025–2026; Tier 2 analyst estimates Why? Because Amazon can close the attribution loop. Someone searches “running shoes” on Amazon, sees an ad, buys the shoes. The advertiser knows the $0.50 worked. Your blog post about running shoes? The reader clicks away, maybe buys on Amazon a week later, and the advertiser has no idea if your impression contributed anything.
Display advertising has always had a measurement problem. Retail media solved it. That’s not a temporary trend.
And then there’s ad blocking. About 32% of US users block ads, 40% in Europe, 49% in Germany. Figures aggregate multiple sources — GlobalWebIndex 2025, Statista, Backlinko synthesis. Primary methodology varies by source; treat as directional consensus Projected to hit a billion users globally in 2026.
Put those together — Google’s property preference, retail media’s attribution advantage, ad blocking — and you have a structural argument. Not a temporary slump. Not an optimization problem. The market is re-routing around display advertising on independent publisher sites.
AI Overviews are the last piece. Search referrals dropped from 16% to 10% of traffic as Google’s AI answers rolled out more aggressively. SparkToro / Datos.com analysis, 2024; single-source finding, directional — not yet replicated across multiple independent studies No clicks means no impressions. No impressions means nothing to monetize.
The RPM Metric Is Lying to You
Here’s the part nobody’s saying clearly enough. RPM — revenue per thousand impressions — only counts the impressions that happened. Ad-blocked impressions don’t show up. They just… disappear from your dashboard, silently.
If 35% of your visitors block ads, your dashboard RPM is calculated on 65% of your actual traffic. A $2.00 RPM in your AdSense panel is $1.30 in real terms — relative to all the humans who visited your site. And you’d have no way to know that from looking at the numbers.
Effective RPM vs. Reported RPM — What the Dashboard Hides
This matters because you can’t diagnose a problem with a metric that hides the problem. A lot of publishers are looking at “$1.30 RPM, down from $2.75” and thinking the issue is the ad technology. The real question is: what’s the revenue-per-visitor number, and how’s that trending? AdSense doesn’t give you that. Google Analytics does, if you set it up right, but most people aren’t tracking it.
Second-Order Mechanism — Why You Don’t Feel the Decline Until It’s Severe
AdSense’s dashboard shows you a number that optimizes for apparent health. Blocked impressions don’t drag down your RPM — they simply don’t exist in the calculation. Traffic that doesn’t click doesn’t affect your average. This means the metric self-selects for the best-case view of your monetization, which is also the least accurate view of your actual revenue trajectory.
The result: publishers typically don’t notice the structural decline until it’s severe enough to show up even in the sanitized metric. By then, 6–12 months of recoverable switching time has passed. The second-order problem isn’t just that AdSense is declining — it’s that AdSense’s own reporting makes the decline hard to detect until it’s gotten expensive.
What AdSense Actually Pays in 2026 — Verified Ranges
Realistic reported RPMs for US/UK traffic right now:
Finance, B2B, SaaS: $2–5. Lifestyle and tech: $1–2. Entertainment and gaming: $0.50–1. These are ranges sourced from publisher forums, MonetizeMore’s publisher data, and SEO community reporting — not AdSense’s own documentation. Directional consensus from multiple practitioner sources; no single authoritative primary dataset exists for RPM by niche — this is the nature of the market
Also worth knowing: Google keeps 32–49% of what advertisers actually pay, depending on the auction. MonetizeMore analysis of AdSense revenue share; Google has confirmed a ~32% publisher revenue share in regulatory filings but the actual effective cut varies — treat 32% as the floor
If you’re seeing sub-$1 RPM in a US/UK commercial niche, that’s not a technical problem you can optimize your way out of. No ad placement trick fixes structural platform decline.
Header Bidding: What It Actually Does and What It Doesn’t
The pitch: instead of Google being the only bidder on your ad inventory, you let 10–20 networks bid in real time. Competition drives prices up.
Does it work? For the right sites, yes. Publisher Collective claims 57% average revenue improvement — but they’re a header bidding vendor, and their incentive is to report the top of the distribution. Publisher Collective self-reported benchmark; conflict of interest present — they benefit commercially from favorable comparisons. Treat as directional upper bound Setupad, another vendor, reports 30–50% typical improvement. Multiple independent publisher accounts on forums cluster around 35–45%.
My planning estimate: 35% for a clean implementation on a well-trafficked site. That’s $350/month extra if you’re making $1,000. That’s $4,200/year you’re currently leaving on the table if you haven’t tested.
“Vendors claim 300% improvements. That’s marketing. The real number for most publishers is 30–50% — meaningful, not miraculous.”
Editorial synthesis — sources: Publisher Collective benchmark (2025), Setupad performance data (2025), WebmasterWorld forum accounts (2025–2026)
The Catch Nobody Leads With
Header bidding adds JavaScript. Done wrong, it tanks your page speed. Page speed tanks your Core Web Vitals. That tanks your Google rankings. You just traded 35% higher ad revenue for 20% lower organic traffic — and you’re worse off.
This is why A/B testing before full rollout isn’t optional. It’s the only way to know if your specific site can absorb the implementation cleanly.
One more thing nobody says: header bidding platforms also depend on Google Ad Exchange for a significant portion of demand. The structural forces killing AdSense — privacy changes, retail media shift, ad blocking — affect the whole ecosystem. You’re getting a better seat. The ship is still listing.
| Platform | Traffic Minimum | Reported Uplift | Disclosure | ⚠ What They Don’t Lead With |
|---|---|---|---|---|
| Ezoic | No strict minimum; accepts early-stage sites | 20–50% typical; vendors claim higher | Self-reported; no independent population audit | Page speed degradation widely reported in publisher communities; requires careful configuration. Ezoic has a commercial interest in favorable benchmarks. |
| Mediavine | $5,000 annual ad revenue (raised in 2026) | Practitioners report 2–3× AdSense for comparable setups | Directional; “2–10×” claims are vendor marketing | The 10× figure is almost always comparing a bad AdSense implementation to an optimized Mediavine setup — not apples to apples. Stricter 2026 content quality requirements. |
| Raptive | 25,000 sessions/month | Similar to Mediavine; food and lifestyle niches perform best | Directional; niche-dependent | Reported session minimum raised periodically. “Made for ads” content increasingly rejected. Network revenue also exposed to same retail media shift affecting AdSense. |
| Setupad | ~100,000 monthly sessions recommended | 30–50% over AdSense for comparable Tier 1 traffic | Vendor-reported; directional | More technical than Ezoic — requires dev resources for clean implementation. Higher upside, higher implementation risk. |
The 30-Day Plan, Organized by What Actually Matters
Week 1 — Diagnose With the Right Numbers
Before you touch anything, pull the numbers that actually matter. Not RPM. Revenue per 1,000 visits. That’s in Google Analytics 4 if you’ve connected AdSense — divide your actual revenue by total sessions and multiply by 1,000. That’s your effective yield. If it’s under $1.00 for US/UK traffic in any niche with commercial buyers, you have a platform problem worth solving.
Also pull: traffic by country, traffic source breakdown, and bounce rate. The first two tell you whether header bidding platforms will even want you. The bounce rate tells you whether the traffic quality is the actual issue.
Estimate your actual ad-blocking rate by multiplying your reported RPM by 0.68 for US traffic, 0.60 for European traffic. That’s your effective RPM — revenue per human who visited.
Week 2 — Pick One Platform and Set Up the Test
One. Not two. You can’t attribute results if you’re running multiple experiments simultaneously.
For under 50,000 monthly sessions: Ezoic is the realistic starting point. No revenue minimum, WordPress plugin implementation, automated optimization. The speed risks are real — monitor your Core Web Vitals before and after, week by week.
For 50,000–100,000+ sessions: Setupad or apply to Mediavine/Raptive. More technical, higher ceiling. If you don’t have a developer who can handle the implementation cleanly, start with Ezoic anyway.
Critical: set up your baseline in GA4 before any switch. Revenue per session, bounce rate, pages per session, organic traffic trend. You need a clean pre-test baseline to interpret the results.
Weeks 3–4 — A/B Test, Then Decide
Split 50/50. Half your traffic stays on AdSense, half goes to the new platform. Run for at least two weeks — less than that and you’re looking at day-of-week noise, not signal.
Track: revenue per 1,000 visits (not RPM), bounce rate change, Core Web Vitals score, organic traffic week-over-week. If the last two are stable or better and revenue is up 20%+, expand to 100%. If revenue is up but organic traffic is down 10%+, you have a speed problem — fix it before expanding.
If revenue is flat or down after a clean two-week test: that platform isn’t right for your traffic mix. Try the next one or accept that AdSense is your ceiling for now and invest in traffic growth instead.
Scenarios: What to Do Based on Where You Are
$2,000+/month
Apply to Mediavine and Raptive. This week.
- Apply to both simultaneously — approval takes time
- Set up Ezoic as the backup while you wait
- A/B test whichever approves first
- Start building an email list for direct sponsorships in parallel
At $2K/month you’re leaving $700–1,400/month on the table. That’s $16,800/year. Run the test.
$500–$2,000/month
Test Ezoic. Watch page speed obsessively.
- Set up GA4 baseline before touching anything
- Implement via nameserver changes (simpler than plugin for most setups)
- Run 2-week A/B test, 50/50 split
- Monitor Core Web Vitals weekly — not monthly
Upside: $150–700/month ($1,800–8,400/year). Worth 30 hours of careful work.
$100–$500/month
Maybe. The math is tighter.
- 35% uplift on $100/month = $35/month = $420/year
- Implementation time: 30–40 hours
- That’s $10.50/hour if you value your time honestly
- Better use: add affiliate links, test direct sponsorships
Not the worst investment, but not the highest-ROI use of your time at this level.
Under $100/month
Don’t. Fix traffic first.
- No ad platform saves a traffic problem
- Get to 10K+ monthly sessions before optimizing monetization
- Focus on keyword research and content quality
- Affiliate marketing probably has higher ROI right now anyway
You don’t have a monetization problem. You have a traffic problem.
The Thesis-Complicating Thing
Here’s what complicates this whole narrative, and I’d rather say it than not. Header bidding platforms are not immune to the same structural forces. They rely on Google Ad Exchange for a meaningful portion of their demand. The advertiser shift toward retail media, the privacy-driven decline in targeting precision, the ad-blocking growth — these affect the whole programmatic ecosystem, not just AdSense specifically.
Publisher Collective and Setupad can outperform AdSense because they run a more competitive auction. But “more competitive auction” doesn’t overcome “fewer advertisers spending on display.” The 30–50% improvement is real and worth capturing. Whether it’s still 30–50% in 2028, when retail media has taken a larger share of advertiser budgets, is genuinely unclear.
Cross-Source Synthesis — Not in Any Single Source
Three datasets in combination point to something none of them states directly. Alphabet’s Q2 2025 earnings establish that Google’s own properties are growing 12% while network ad revenue is flat-to-declining. Amazon’s advertising growth data shows advertisers moving toward closed-loop attribution. SparkToro’s AI Overviews traffic data shows organic search referrals shrinking.
Taken together: the independent publisher is being squeezed from three directions simultaneously — fewer clicks arriving (AI Overviews), lower advertiser spend on display (retail media shift), and the platform they depend on deprioritizing their inventory (Google’s property-first economics). Each force is documented independently. The combination, acting simultaneously on the same revenue line, is compounding in a way that makes linear improvement strategies — better ad placement, A/B testing ad formats — inadequate responses to what is structurally a revenue model transition problem.
The 30–50% uplift from header bidding helps. It doesn’t address the compound.
For Publishers Who’ve Already Switched
For: Publishers on Mediavine, Raptive, or Ezoic already
The Monitoring Gap You Probably Have
Most publishers who switch to premium networks stop tracking revenue-per-session after the first good month. That’s a mistake. The structural forces described above — retail media shift, AI search traffic decline — affect your premium network too, just with a time lag behind what AdSense shows you.
What to track monthly: revenue per session (not RPM), organic traffic trend from Google Search Console, and total display revenue as a percentage of total site revenue. If display is above 80% of your total revenue in 2026, that’s a concentration risk worth diversifying — email list, affiliate income, direct sponsorships, or digital products.
For: Site owners outside US/UK/Canada
The Geographic Reality Nobody Wants to Tell You
Most header bidding platforms and premium networks are built around Tier 1 advertiser demand — US, UK, Canada, Australia, Western Europe. If the majority of your traffic comes from India, Southeast Asia, Latin America, or Eastern Europe, switching platforms won’t fix the underlying demand gap. Advertiser CPMs for these geographies are structurally lower, and that’s not changing.
The honest path for non-Tier-1-heavy traffic: affiliate marketing programs with global reach (Amazon Associates, niche programs specific to your region’s commercial categories), native advertising networks like Taboola or Outbrain which have broader geographic coverage, email list building for direct sponsorship from brands who want your specific audience, and digital products — templates, guides, courses — where geographic location doesn’t determine the buyer’s willingness to pay.
The Honest Final Word
AdSense is in structural decline. Not because Google turned evil. Because the market found better options. Retail media has attribution. AI answers have clicks. Independent publisher display advertising has neither.
Header bidding helps. For the right sites — Tier 1 traffic, commercial niches, clean technical implementations — 30–50% is real and worth capturing. Test it. Track revenue per session, not RPM. Watch your Core Web Vitals like a hawk for six weeks after any change.
But be honest about what it doesn’t fix. You’re improving your position within a category that’s contracting. The longer-term play is diversifying away from display advertising entirely — email, affiliate, products, sponsorships — so that your revenue base isn’t dependent on whether programmatic advertising has a good quarter.
“Paste the AdSense code and collect checks” is over. The publishers who survive the next three years aren’t the ones who found the best ad platform. They’re the ones who stopped depending on ad platforms as their primary revenue source.
Sources & Verification Notes
- PPC Land — Google Ad Platform Failures Coverage: January 2026 infrastructure failure reporting. Tier 2; sourced from publisher self-reporting, not independently audited.
- Search Engine Land — Publisher Revenue Plunge Reports: Ongoing coverage of AdSense RPM trends 2025–2026. Tier 2; aggregated publisher accounts.
- WebmasterWorld Forum Thread, January 13–15, 2026: Self-reported RPM figures. Selection bias: forum skews toward publishers experiencing problems. Directional only.
- Alphabet Q2 2025 Earnings Report: $54.2B own properties, $7.4B network advertising. Investor.abc.xyz. Tier 1; verified public filing.
- WARC and eMarketer: Amazon advertising revenue $60.6B (2025), forecast $69.7B (2026). Tier 2 analyst estimates; methodology not fully public.
- GlobalWebIndex / Statista: Ad blocking rates by country. 32% US, 40% Europe, 49% Germany. Tier 2; methodology varies across underlying sources.
- SparkToro / Datos.com: AI Overviews traffic impact — search referrals 16% to 10%. Directional; single-source finding, not yet replicated independently.
- Publisher Collective header bidding benchmark: 57% average improvement claim. Vendor-reported; commercial conflict of interest present. Treat as directional upper bound.
- Setupad performance comparison: 30–50% typical improvement. Vendor-reported; directional.
- MonetizeMore: AdSense revenue share analysis, alternative platform guides. MonetizeMore.com. Tier 2/3; publisher-adjacent vendor with commercial interest in alternatives to AdSense.
Traffic Arbitrage 2026: Profitable, But the Spread Is Collapsing
High-CPC Keyword Strategy: What Actually Moves Ad Revenue in 2026
Semrush High CPC Keywords: The Exact Method SEOs Use to Find $50–$1,000 Clicks in 2026
How I Built a $4,200/Month Niche Site in a Low-Competition Vertical: The Complete 2026 Case Study
E-E-A-T and AI Overviews: what Google’s systems actually evaluate (and what most implementation guides get wrong)