
An evidence review of field data, WordPress core benchmarks, and vendor claims. Updated October 31, 2026.
By Tom Morgan · 18 min read
Quick answer About 48% of WordPress sites pass all three Core Web Vitals on mobile (September 2026), and the failing metric is almost always Largest Contentful Paint (LCP). Fix it in this order: server response and edge caching first, then how the hero image is discovered and prioritized, then render-blocking CSS and scripts. Which caching plugin you choose matters less than your host, your page builder, and whether the hero image is lazy-loaded by mistake.
Contents
- The short version
- How this was built, and what I could not verify
- Where WordPress stands in late 2026
- What actually moves LCP
- Builders, hosts and plugins: what the field data shows
- The stack I would run, and when I would change it
- Configuration traps that undo the stack
- A 28-day playbook
- Claims I would push back on
- Limits of this review
- FAQ
- Sources
The short version
Most WordPress sites that fail Core Web Vitals fail one metric: LCP. Interactivity is not the problem, and layout shift is mostly fine. LCP fails for three ordinary reasons. The server answers slowly, the browser finds the hero image late, and CSS or scripts block the first paint. Plugins can fix the second and third. They can only soften the first.
- The pass rate is still below the web average. In the September 2026 HTTP Archive data, 53.7% of WordPress desktop origins and 48.3% of mobile origins passed all three metrics. Across all technologies, the same dataset shows 60.8% desktop and 52.8% mobile.
- INP is not the issue. 99.0% of WordPress desktop origins and 90.3% of mobile origins have good INP. LCP (69.3% desktop, 55.4% mobile) and server response (31.4% and 22.9% good) are where sites lose.
- Discovery and priority beat file format. In a WordPress core committer’s benchmark, fixes that stop the browser downloading oversized or late-discovered images did far more for LCP than converting to AVIF.
- Your host and builder matter more than your cache plugin. In field data the six WordPress caching plugins span 10 to 13.5 points. Hosts span 22.6 to 24.2 points. Builders span 17.5 to 29.3.
- Most “best plugin for Core Web Vitals” rankings are vendor or affiliate content. This article marks which numbers are neutral and which are not.
- Google does use Core Web Vitals in ranking, but says good scores do not guarantee a top position. The stronger reason to fix them is conversion.
How this was built, and what I could not verify
This is an evidence review, not a hands-on test. I did not run a plugin stack on a production site for this article, and I say so because the title of most articles on this topic implies otherwise.
Sources fall into four groups: HTTP Archive Tech Report data as published by two analysts who cite the dataset, a WordPress core committer’s published benchmarks, Google’s own documentation and case studies, and vendor material that I treat as marketing.
Three honesty notes before the numbers:
- HTTP Archive’s interactive dashboards were not queried directly. Every field figure here reaches you through a publisher that cites HTTP Archive. Before you republish a number, open the Tech Report and confirm it for the month you need.
- Different snapshots appear on purpose. Headline pass rates use the September 2026 crawl. The host, page-builder, and caching-plugin breakdowns come from the June 2026 crawl, the newest breakdown I could verify. Where they are mixed, the table says which month it is.
- Third-party pass rates disagree, and that is normal. While researching, I saw WordPress mobile pass rates quoted as 38.4%, 43.4%, 45%, 46.3%, 48.3%, and 48.8%. Some are from different months (June 2025 versus November 2025 versus June 2026), some mix mobile and desktop, and at least one comes from an aggregator that does not describe its method. I leaned on sources that name the crawl month and sample size.
One more gap: I did not find a neutral, field-data, head-to-head test of caching plugins. What exists is vendor blogs, affiliate reviews, and lab tests on demo sites.
Where WordPress stands in late 2026
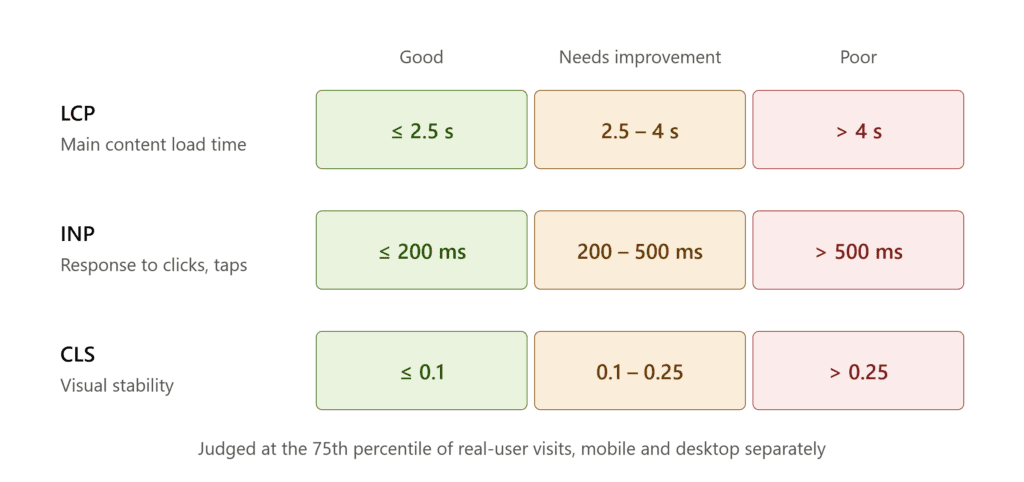
Core Web Vitals pass when a page’s LCP is 2.5 seconds or less, INP is 200 milliseconds or less, and CLS is 0.1 or less, all measured at the 75th percentile of real visits.
September 2026, WordPress origins with enough real-user data (HTTP Archive Tech Report, relayed by WPExposure):
| Metric | Desktop good | Mobile good |
|---|---|---|
| All three Core Web Vitals | 53.7% | 48.3% |
| LCP (≤ 2.5 s) | 69.3% | 55.4% |
| INP (≤ 200 ms) | 99.0% | 90.3% |
| CLS (≤ 0.1) | 74.7% | 87.3% |
| TTFB (≤ 800 ms, diagnostic only) | 31.4% | 22.9% |
Two cautions. INP is only reported for origins with enough interactions, so the 99.0% describes measurable sites, not every site. And TTFB is not a Core Web Vital, but it eats directly into the LCP budget: a server that takes 1.5 seconds to respond has spent most of a 2.5-second allowance before the browser has seen any HTML.
The long arc: everything improved except the server
These are June snapshots from the HTTP Archive Tech Report, compiled by Hostingstep (a hosting reviewer that discloses affiliate commissions; the underlying data is HTTP Archive’s).
| June | All CWV, desktop | All CWV, mobile | LCP, desktop | CLS, desktop | Good TTFB, desktop |
|---|---|---|---|---|---|
| 2020 | 18.2% | 14.9% | 31.8% | 47.2% | 26.0% |
| 2021 | 25.0% | 18.9% | 39.4% | 58.0% | 29.2% |
| 2022 | 30.1% | 29.6% | 45.5% | 61.1% | 31.1% |
| 2023 | 36.5% | 31.7% | 53.3% | 63.7% | 34.6% |
| 2024 | 45.0% | 39.7% | 60.8% | 70.0% | 33.1% |
| 2025 | 48.9% | 43.4% | 65.2% | 71.4% | 31.6% |
| 2026 | 53.3% | 48.8% | 69.3% | 73.9% | 33.2% |
Pass rates roughly tripled in six years. Good server response moved from 26.0% to 33.2%, and it has been flat since 2023. That is the whole shape of WordPress performance in one table. Everything a site owner shapes through themes, images, and plugins got better. The part you rent from a host barely moved.
Between June 2026 and September 2026, the headline figures were nearly unchanged (48.8% to 48.3% on mobile). Three months is too short to call a trend, but it is a reminder that the steady gains of 2020 to 2025 are not guaranteed to continue.
WordPress against other platforms
| Platform (June 2026) | Hosting model | Desktop pass | Mobile pass | Good TTFB, desktop |
|---|---|---|---|---|
| Wix | Fully hosted | 87.1% | 80.1% | 61.6% |
| Duda | Fully hosted | 86.7% | 85.5% | 84.5% |
| Webflow | Fully hosted | 81.0% | 68.1% | 78.9% |
| Shopify | Fully hosted | 78.8% | 76.5% | 93.1% |
| Squarespace | Fully hosted | 71.1% | 70.1% | 95.1% |
| Drupal | Self-hosted | 64.6% | 63.9% | 59.3% |
| Joomla | Self-hosted | 59.1% | 57.0% | 49.7% |
| WordPress | Self-hosted | 53.3% | 48.8% | 33.2% |
| Magento | Self-hosted | 43.6% | 44.3% | 22.4% |
The pattern is hard to miss: platforms that ship edge delivery by default clear TTFB, and platforms where the owner picks the server do not. Hostingstep’s group averages put good TTFB at 82.6% for the five fully hosted platforms and 41.1% for the four self-hosted ones.
A fair reading is that WordPress is not “slow”. It is the most widely installed CMS, installable anywhere by anyone, so its average includes every cheap host and every heavy theme. Among the top 100,000 WordPress sites by traffic, 63.3% have good desktop TTFB, against 33.2% across all WordPress origins. Same software, different servers.
A counterpoint worth knowing about: monitoring vendor DebugHawk reported that 86% of pageviews passed LCP across WordPress sites it monitors (median LCP 1.1 seconds, Q4 2025), and that 65% of pageviews had good TTFB. That looks far better than the crawl-wide figures, for two reasons. It counts pageviews rather than origins, so busy, well-run sites dominate. And sites that pay for monitoring are not a random sample. It is a vendor dataset, but it shows that your outcome depends on how seriously the site is run.
What actually moves LCP
LCP has four parts: server response (TTFB), the delay before the browser starts loading the LCP resource, the time that resource takes to download, and the delay before it is painted. Plugins that only shrink the download are working on one slice. The bigger gains usually come from the other three.
Lab evidence from a stock theme
The most useful neutral test I found is Weston Ruter’s. Ruter is a WordPress core committer on the Core Performance Team. In a 2025 write-up he measured what each Performance Lab feature does to LCP on the default Twenty Twenty-Five theme, using Google’s open-source wpp-research tool with an emulated Moto G4 on Fast 4G and medians over many runs.
What came out:
- Flashy image plugins did almost nothing for LCP. AVIF conversion shrank the test image by about 18% (356 KB to 292 KB) and moved LCP by roughly 2%. Download time is a small share of LCP, which matches what Google engineers have written about LCP myths.
- The winners fix discovery and priority, not file size. Enhanced Responsive Images stops the browser downloading a 2048-pixel file for a 300-pixel slot. In Ruter’s benchmark, correcting the
sizesattribute cut transferred image bytes by 87%, versus 29% for switching format. - Guessing the LCP image is error-prone. Image Prioritizer, which relies on the companion Optimization Detective plugin, learns from real visits which image is the LCP element on each screen size and preloads that one. Ruter found that even when core guesses right for one viewport, about 37% of pages have a different LCP image on the other viewport. A single
fetchpriority="high"guess is wrong a lot.
The fine print matters. These are lab runs on a local install with no page cache and a fast baseline, so the “before” numbers are already about a second. A 50% cut from 1,020 ms is real, but it is not the same as taking a sluggish production site from 4 seconds to 2. Treat the percentages as a ranking of which kind of fix works, not as a forecast.
Speculative loading and the slow-server test
WordPress added Speculation Rules support in 6.8. Ruter added an artificial one-second server delay to mimic a typical slow WordPress response, then measured LCP on the next page a visitor clicks:
| Setting | LCP on navigation | Change |
|---|---|---|
| No speculation (WordPress 6.7 behavior) | 2.17 s | n/a |
| Conservative prefetch (WordPress 6.8 default) | 2.12 s | −2.3% |
| Moderate prefetch | 1.04 s | −52.1% |
| Moderate prerender | 0.04 s | −98.2% |
The shipped default is deliberately timid and barely changes anything. The aggressive settings are dramatic but cost something: eager speculation can tax weak servers, and prerendering can interact badly with analytics and ads. It also only helps subsequent page views. It does nothing for the first-visit LCP that Google’s field data mostly captures from search landings.
A related trick covers back and forward navigation. The Instant Back/Forward plugin removes a no-store header that blocks the browser’s back-forward cache. In Ruter’s BuddyPress demo, a back navigation dropped from a 1.41 s LCP to 0.02 s.
What about WordPress 7.x?
WordPress 7.0 shipped on May 20, 2026, and 7.1 (“Mary Lou”) on August 19, 2026. By WordPress.org’s telemetry, 71% of reporting sites were on a 7.x release in October 2026. I could not find an independent field-data measurement that isolates what 7.0 or 7.1 did to LCP, and the vendor pages claiming “40% faster” give no method, so I am not repeating them. What I can say is that core keeps shipping sensible defaults (skipping lazy-load on early images, adding fetch priority to a likely candidate), so a modern site that still lazy-loads its hero is usually being overridden by a theme, a builder or a performance plugin.
Related and measurable: 35.3% of reporting WordPress sites run a PHP version older than 8.2, which no longer gets security updates, and PHP 8.2 itself reaches end of life on December 31, 2026. That is a security issue first. Check your PHP version anyway, because an outdated runtime is a cheap thing to rule out when TTFB is poor.
What speed is worth
This is not a WordPress case, but it is the best-documented proof that moving LCP moves revenue. Vodafone Italy ran an A/B test where the optimized page had a 31% better field LCP. According to Google’s case study, that produced 8% more sales, a 15% better lead-to-visit rate, and an 11% better cart-to-visit rate.
The detail that usually gets dropped: the optimized page’s LCP was 5.7 seconds against 8.3 seconds for the default. Both are failing scores. The gains came from rescuing a very slow page, not from polishing a fast one. If your LCP is already under 2 seconds, expect smaller returns. The study is also from 2021 and reports results for a large brand with an engineering team. It shows direction, not a guarantee for a 40-page blog.
Builders, hosts and plugins: what the field data shows
All figures in this section are June 2026 HTTP Archive data via Hostingstep. They are correlations across millions of independently built sites, not controlled experiments. A builder that attracts beginners will look worse partly because of its audience.
Page builders
| Builder | Desktop pass | Mobile pass | Sites measured |
|---|---|---|---|
| Bricks | 60.9% | 54.3% | 17,345 |
| Beaver Builder | 58.3% | 53.8% | 54,431 |
| WordPress Block Editor | 57.1% | 53.0% | 922,497 |
| Oxygen | 48.0% | 52.3% | 19,759 |
| Elementor | 43.4% | 36.8% | 1,415,046 |
| WPBakery | 39.2% | 38.7% | 372,913 |
| Divi | 31.6% | 42.7% | 245,984 |
Hosts (a selection of eight)
| Host | Desktop pass | Mobile pass | Good TTFB, desktop | Sites measured |
|---|---|---|---|---|
| WP Engine | 68.0% | 65.9% | 53.1% | 173,516 |
| Kinsta | 64.7% | 58.4% | 32.8% | 59,459 |
| Cloudways | 57.0% | 55.3% | 36.0% | 35,135 |
| Liquid Web | 54.4% | 48.9% | 42.7% | 6,824 |
| Hostinger | 52.7% | 44.7% | 40.9% | 484,335 |
| SiteGround | 52.6% | 52.7% | 28.4% | 191,306 |
| Bluehost | 52.4% | 41.7% | 34.5% | 63,789 |
| Flywheel | 45.4% | 44.6% | 8.5% | 21,939 |
Caching plugins and CDN
| Technology | Desktop pass | Mobile pass | Good TTFB, desktop | Sites measured |
|---|---|---|---|---|
| Cloudflare (all sites, not only WordPress) | 58.8% | 50.8% | 58.3% | 6,532,800 |
| NitroPack | 57.6% | 57.7% | 32.6% | 23,697 |
| FlyingPress | 56.0% | 54.8% | 33.7% | 6,929 |
| Perfmatters (script manager, not a cache) | 56.0% | 51.4% | 32.4% | 31,692 |
| WP Rocket | 53.2% | 52.3% | 32.4% | 494,157 |
| LiteSpeed Cache | 51.6% | 50.5% | 33.6% | 593,387 |
| WP Super Cache | 51.1% | 46.9% | 28.7% | 134,456 |
| W3 Total Cache | 47.6% | 44.2% | 27.0% | 138,391 |
| All WordPress | 53.3% | 48.8% | 33.2% | 4,472,428 |
How to read these tables without fooling yourself
1. The spread depends on which device and which items you compare. A common claim is that “builders matter most”. Here is the same data cut more carefully (spread = best minus worst in each table, computed from the tables above):
| Choice | Desktop spread | Mobile spread |
|---|---|---|
| Six WordPress caching plugins | 10.0 pts | 13.5 pts |
| Page builders (all seven) | 29.3 pts | 17.5 pts |
| Page builders (without Divi) | 21.7 pts | 17.5 pts |
| Hosts (the eight listed) | 22.6 pts | 24.2 pts |
Divi’s unusual desktop result (31.6% desktop but 42.7% mobile) inflates the desktop builder spread. Hostingstep attributes it mainly to layout stability: only 49.5% of Divi origins have good desktop CLS. On mobile, hosts spread the most. The honest conclusion is narrower than “builders matter most”: hosts and builders each move results by roughly twice as much as the choice among caching plugins.
2. Every cache plugin sits at the same server-response rate. Good TTFB is 27% to 34% for all of them. That makes sense. A page cache on your own server speeds up PHP and database work, but it does not shorten the trip to the visitor. Cloudflare is the outlier at 58.3% because it can answer from an edge location (it also covers all kinds of sites, so read it as a hint).
3. Sample sizes are lopsided. FlyingPress has under 7,000 measured sites; WP Rocket nearly 500,000. And people who buy a premium plugin may do so because their site was slow, or because they already care about speed. The data cannot separate those two stories.
4. Location is a hidden variable. In the same data, WordPress mobile pass rates run from 78.3% in Estonia to 4.4% in Nigeria (the United States is 62.9%, India 27.6%). If your audience is far from your server, a CDN stops being optional.
5. Vendors cite this data too. NitroPack’s blog uses HTTP Archive numbers to put itself ahead of FlyingPress and WP Rocket, and the FlyingPress-versus-WP-Rocket affiliate reviews I read all conclude FlyingPress wins. The field data agrees on direction but shows small gaps between them. Read vendor comparisons as marketing that happens to point at real numbers.
The stack I would run, and when I would change it
This is my synthesis, not a measured result. The evidence column says how much weight each recommendation can bear.
| Layer | What to use | Why | Evidence |
|---|---|---|---|
| 1. Server and edge | A host with good measured TTFB for your audience’s region, plus a CDN that can cache HTML | Good TTFB barely moved in six years; top-100k WordPress sites reach 63.3% versus 33.2% overall | Strong (field), correlational |
| 2. Theme and builder | A block theme or a lean builder; avoid heavy DOM output | Builder spread is 17.5 to 29.3 points | Strong (field), correlational |
| 3. One page cache and optimizer | WP Rocket, FlyingPress or NitroPack, or LiteSpeed Cache if your host runs LiteSpeed. Pick one | Critical CSS, deferred scripts, preload handling. Differences between them are small in field data | Moderate; vendor claims weak |
| 4. Core-team performance plugins | Enhanced Responsive Images, Image Prioritizer with Optimization Detective, tune Speculative Loading | Biggest measured LCP gains in neutral lab tests | Moderate (lab, default theme) |
| 5. Script discipline | A script manager such as Perfmatters, or your optimizer’s per-page controls | Only matters if traces show third-party or unused script cost | Weak to moderate |
| 6. Measurement | PageSpeed Insights field data, Search Console, and the open-source web-vitals library for your own real-user monitoring | Lab scores lie; field data decides the pass | Strong |
Pick your path
Start from your situation, not from a plugin list.
| Your situation | Do this | Avoid |
|---|---|---|
| Your host runs LiteSpeed | Use LiteSpeed Cache with server-level caching, then add layer 4 | Adding a second page-cache plugin on top |
| You are on a managed host with its own page cache | Use the host’s cache, check its documentation for what it already handles (compression, critical CSS, image handling), then add layer 4 | Installing an optimizer that duplicates the host’s features |
| You are on generic shared hosting or a VPS | Choose one optimizer (WP Rocket, FlyingPress or NitroPack), put a CDN in front, and test whether the CDN can cache HTML | Stacking several optimizers, or relying on a cache plugin to fix a 1.5-second server response |
| Your audience is far from your server | A CDN with HTML caching first; nothing else will change TTFB much | Spending days on image plugins |
| You use Elementor, Divi or WPBakery and LCP fails | Audit the hero template’s DOM and hero element before adding plugins; consider moving your highest-traffic landing templates to a block theme | Assuming a cache plugin will repair heavy markup |
| INP or CLS is what fails (rare) | Profile the slow interaction or add dimensions to images and reserved space for embeds | Applying LCP fixes to an INP problem |
Diagnose before you install anything
Open PageSpeed Insights on a failing URL, read the field section first, then use the LCP breakdown to find which part is long.
| If this part is long | It usually means | First fix |
|---|---|---|
| TTFB over 800 ms | No page cache, slow host, distant server, outdated PHP | Full-page caching, CDN with HTML caching, check PHP version |
| Delay before the LCP resource starts loading | The browser found the image late: lazy-loaded, CSS background, or injected by JavaScript | Make it a real image element, remove loading="lazy", add fetchpriority="high" |
| Download time of the LCP resource | Oversized file, wrong sizes | Enhanced Responsive Images, correct dimensions, then format |
| Delay before it paints | Render-blocking CSS, web fonts, heavy scripts | Critical CSS, deferred scripts, font loading |
Notes on the choices
Why one optimizer, not two. Two plugins both minifying, combining, preloading, and setting fetch priority is how you get duplicate preload tags and broken layouts. If you add Image Prioritizer to a site already running an optimizer with its own LCP-image handling, view the page source and confirm you do not have two competing hints for the same image. I have not seen a neutral compatibility test, so verify on your own pages.
Why I would skip two Performance Lab modules for speed purposes. In Ruter’s test, Image Placeholders did nothing for LCP, and Modern Image Formats gave about 2% on a single-image page. They are fine for perceived quality and bandwidth. Just do not expect them to fix a failing assessment. View Transitions are pleasant and have no LCP effect.
A caution on Optimization Detective. It builds its picture from real visitors’ measurements. That is the point, but it also means a page with almost no traffic has little to learn from. Expect gains on busier templates first.
On script tools and INP. With 90.3% of WordPress origins already passing INP on mobile, do not spend your afternoon delaying JavaScript unless your own data says INP fails. Aggressive “delay until interaction” settings can break menus, forms, and sticky headers, and they sometimes shift work onto the first tap. Test your top five templates by hand.
On settings. I have deliberately not listed per-plugin option names. They change between versions, and I would rather you read the current documentation than follow a screenshot from last year. In any optimizer, enable features one at a time (page cache, then critical CSS, then script deferral, then delay), and reload your top templates after each change.
Configuration traps that undo the stack
- Lazy-loading the hero. Check the first image on every template for
loading="lazy". Remove it and addfetchpriority="high"to the real LCP image. - A hero built as a CSS background. Browsers cannot discover these early. Page builders and the Cover block do this constantly. Image Prioritizer preloads them, or you can switch the hero to a real image element.
- Preloading the wrong image on mobile. Your desktop hero and mobile hero can be different elements. Use a tool that checks both.
- Chasing the Lighthouse score. A Lighthouse 100 is not a pass. Google’s own data, quoted by Ruter, found that 43% of pages scoring 90 or more in a September 2021 sample still missed at least one Core Web Vitals threshold. Field data is the judge.
- Optimizing a template that is not failing. Search Console groups URLs by template. Fix the failing group, not the homepage you happen to open most.
- Running two page caches. Host-level cache plus a plugin cache plus a CDN rule, all with different purge logic, is the classic source of “my edits do not show up”.
A 28-day playbook
CrUX reports a rolling 28-day window, so you cannot judge a change in a week. This is the order I would work in.
Day 0: diagnose. Open PageSpeed Insights for a failing URL and read the field section first. Note which metric fails, on which device, and whether the data is for the URL or the whole origin. If TTFB is above 800 ms, stop and fix hosting or caching before touching images.
Days 1 to 3: server layer. Turn on full-page caching, confirm cached responses return quickly, update PHP, and put a CDN in front if your audience is geographically spread. Re-test TTFB from the regions that matter.
Days 4 to 7: the LCP element. Identify the LCP element on your top templates. Remove lazy-loading from it, make sure it is a real image, give it fetchpriority="high", and install Enhanced Responsive Images so mobile is not downloading desktop files.
Days 8 to 12: render-blocking. Enable critical or inlined CSS in your optimizer, defer non-critical scripts, and trim fonts. Check every template visually after each change.
Days 13 to 15: only if needed. If INP is failing, record a trace of the slow interaction and find the responsible script before touching any settings. If CLS fails, add width and height to images and reserve space for embeds and ads.
Days 16 to 28: wait and watch. Do not stack new changes while field data catches up. Check Search Console’s Core Web Vitals report at day 28. If lab numbers improved but field numbers did not, the cause is usually your real visitors’ devices and networks, not your settings.
Claims I would push back on
“Core Web Vitals are a big ranking factor.” Google’s documentation says its core ranking systems use Core Web Vitals, and also that good scores in Search Console or third-party tools do not guarantee top rankings. It adds that chasing perfect scores purely for SEO may not be the best use of your time, and that other page experience aspects are not used directly in ranking. My read: fix them for users and conversion, and treat rankings as a bonus. Claims that they are a “minor” or “major” factor are analysts’ judgments, not Google’s.
“WordPress is slow.” The data says something narrower. Well-hosted WordPress sites with lean themes do fine. The platform’s average is dragged down by a long tail of weak hosting and heavy builds.
“Install this one plugin and you will pass.” The field data does not support it. Caching helps, but it does not change your host, your builder or your hero image.
“Faster always means more revenue.” The strongest public evidence comes from large brands starting at very slow baselines. Measure your own conversion before and after.
Limits of this review
- Field numbers come through intermediaries. HTTP Archive’s dashboards were not queried directly.
- Host, builder, and plugin tables are from the June 2026 crawl. September 2026 breakdowns for those groups were not available to me.
- The core benchmarks use the default theme on local installs with emulated devices. Real builder-heavy sites will behave differently.
- Plugin-by-plugin field comparisons are confounded by who installs what.
- Hostingstep, my main source for the breakdowns, is a hosting reviewer with affiliate relationships. The figures are HTTP Archive’s, but the framing is theirs.
- I did not find an independent field measurement of WordPress 7.0 or 7.1’s effect on LCP.
- The recommended stack is my synthesis, labeled as such. I have not run it on a live site for this article.
- Plugin pricing and features change often. Check current terms before buying.
FAQ
What percentage of WordPress sites pass Core Web Vitals in 2026? In the September 2026 HTTP Archive data, 48.3% of WordPress mobile origins and 53.7% of desktop origins pass all three metrics. Other publishers quote different figures because they use different months, devices, and denominators.
Which Core Web Vital should I fix first on WordPress? LCP, because it is the one most sites fail. Check TTFB before anything else, since it sets the floor for LCP.
Do I need a paid plugin to pass Core Web Vitals? No. Core handles fetch priority and lazy-loading defaults; the Performance Lab plugins are free, and LiteSpeed Cache is free on compatible hosts. Paid optimizers mostly save configuration time.
Is WP Rocket better than FlyingPress or LiteSpeed Cache? Field data shows small gaps between them (about 1 to 4 points on desktop in the June 2026 data), and the groups differ in size and in who installs them. I found no neutral head-to-head test, so choose based on your host, your budget, and how much configuration you want to do.
Will fixing Core Web Vitals improve my Google rankings? Google says Core Web Vitals are used by its ranking systems but do not guarantee top positions. Fix them for users and conversion first.
How long until Search Console shows an improvement? Allow at least 28 days after your last meaningful change, because field data uses a rolling 28-day window.
Is a 100 PageSpeed score the goal? No. The goal is passing the field assessment at the 75th percentile for your real visitors.
Sources
Field data
- HTTP Archive, Tech Report: WordPress (September 2026 figures as relayed by WPExposure)
- WPExposure, WordPress Statistics 2026 (data as of October 18, 2026)
- Hostingstep, Core Web Vitals Statistics 2026 (HTTP Archive June 2026 crawl; updated August 7, 2026; affiliate disclosure on site)
- Octo Agency, Website Speed Statistics 2026 (all-origin pass rates, September 2026)
- HTTP Archive, Web Almanac 2025: CMS
- DebugHawk, What 5.7 million pageviews reveal about WordPress performance (vendor data, Q4 2025)
WordPress core and benchmarks
- Weston Ruter, The Site Speed Frontier with Performance Lab and Beyond (August 2025)
- WordPress.org, WordPress 7.1 “Mary Lou” and WordPress stats
- WordPress.org plugin pages: Performance Lab, Optimization Detective
- Google Search Central, Understanding page experience in Google Search results
- Google Search Central, The role of page experience in creating helpful content
- web.dev, Vodafone: A 31% improvement in LCP increased sales by 8% (March 2021)
Read with caution (vendor sources)
- NitroPack and similar plugin-vendor blogs that cite HTTP Archive for their own comparisons