
How to Fix Largest Contentful Paint
Without Breaking Your Design
Your hero image is beautiful. Your designer loves it. And right now it is silently strangling your rankings while 38% of your visitors give up and leave. Here is everything you need to fix that — without touching a single pixel of the design.
Let me tell you about a mistake I made in 2023 that cost a client somewhere north of $60,000 in organic revenue over four months.
We had just shipped a beautiful redesign for a mid-market e-commerce site. New typefaces. A cinematic 1800×900 hero image shot on location in Iceland. A subtle Ken Burns animation on that image to give it life. The designer was proud of it and so was I, honestly. The client loved it.
And then the Core Web Vitals report arrived. LCP: 7.1 seconds. Mobile field data. 75th percentile.
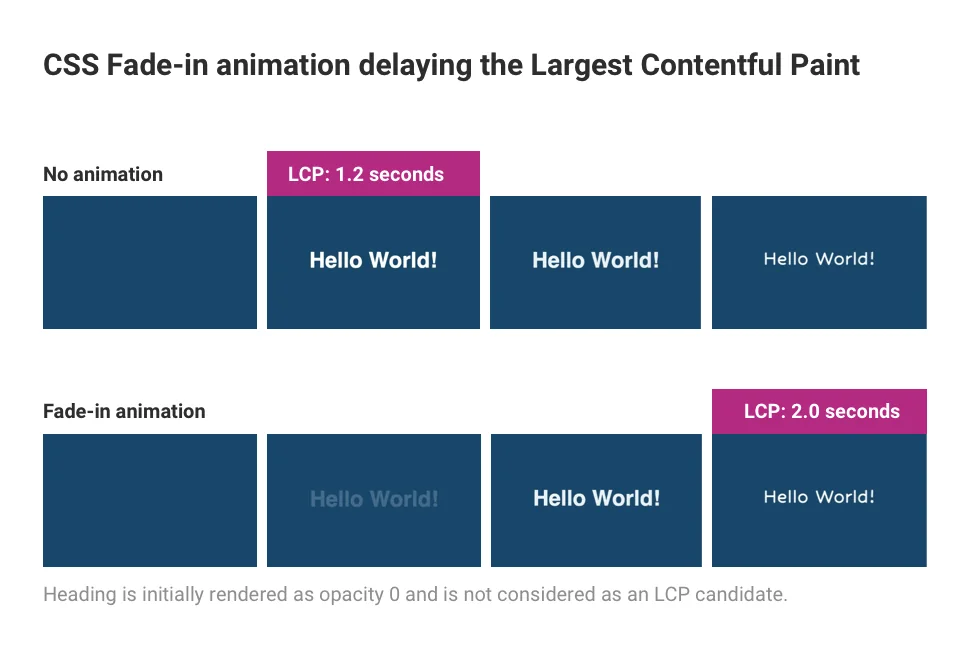
The ranking drop didn’t come immediately — Google’s CrUX data lags by about 28 days — but when it came, it hit hard. What I’d failed to account for was that the Ken Burns animation used opacity: 0 as a starting state, which means Chrome was not even counting it as an LCP candidate until the JavaScript fired, the class toggled, and the image faded in. We’d inadvertently told the browser: “Don’t measure this until the animation is done.” That single design decision added roughly 2.8 seconds to our LCP on mobile.
The fix took 45 minutes. The damage took months to reverse.
This guide is everything I know now, organized so you don’t make the same mistakes. We’re going to go deep on the mechanics of LCP, build a diagnostic framework that actually tells you which of the four sub-phases is killing your score, and then work through every meaningful fix — including the awkward ones that involve pushing back on your designer.
1. What LCP Actually Measures (And What It Doesn’t)
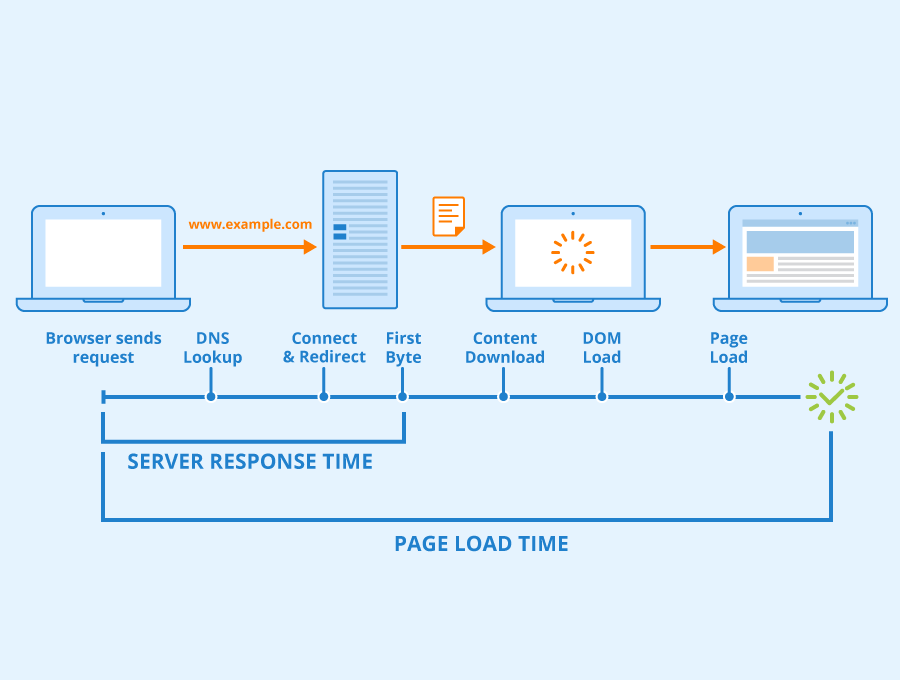
Largest Contentful Paint reports the render time of the largest image, text block, or video visible in the viewport, measured from the moment the user navigates to the page. According to Google’s official LCP specification on web.dev, the measurement includes everything upstream: unload time from the previous page, DNS lookup, TCP connection setup, TLS handshake, redirect time, and Time to First Byte. By the time a single pixel of your hero image hits the screen, you’ve potentially burned through all of those clocks.
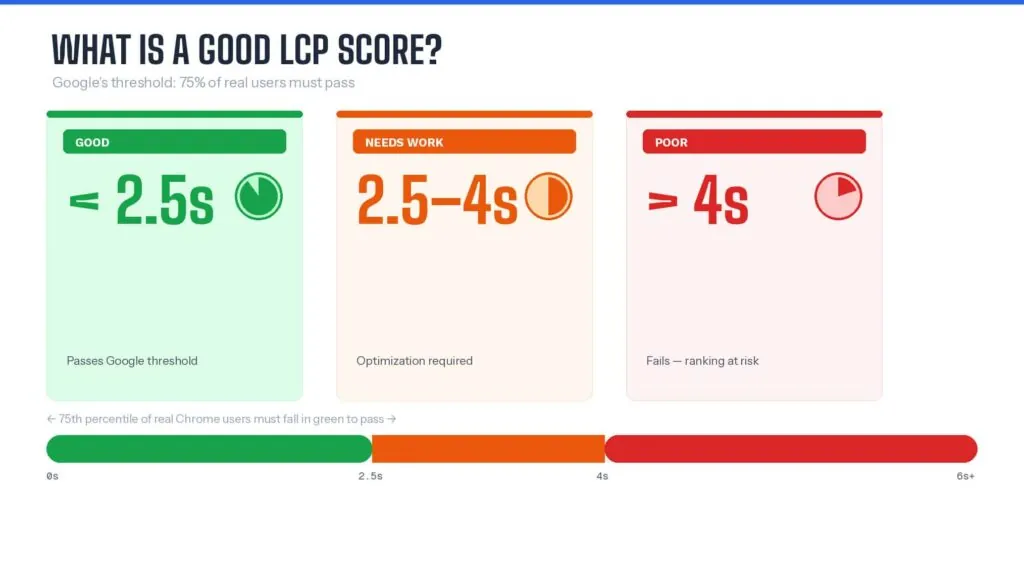
The “good” threshold is 2.5 seconds or less, measured at the 75th percentile of real user sessions. That “75th percentile” framing is critical and widely misunderstood. You don’t need your average user to have good LCP — you need 75 out of every 100 users to have good LCP. That means your worst quartile sets your grade. And your worst quartile is almost always someone on 4G in a weak signal area, on an old mid-range Android, cold-loading a page with no cache. Optimize for that person, not for your MacBook on fiber.
The eligible elements for LCP are: <img> elements, <image> inside SVG, <video> poster images or first frame, elements with a CSS url() background image, and block-level text elements like headings and paragraphs. Critically: CSS gradients don’t count. A full-bleed gradient background is invisible to the LCP algorithm.
A Lighthouse LCP score and your actual CrUX field data are measuring different things. Lighthouse runs in a controlled lab environment from a single geographic location. Your CrUX data (what Google uses for rankings) aggregates real user sessions across your actual traffic mix. They can diverge by 40-60% on sites with international audiences. Always optimize for CrUX field data in Google Search Console, not just Lighthouse lab scores.
LCP also has a somewhat counterintuitive behavior: it keeps updating as new larger elements paint, until the user first interacts with the page (scroll, click, tap). This means a page with a progressive loading pattern might update its LCP candidate two or three times before settling. The final candidate before first user interaction is what gets reported. This matters when you’re debugging with the Chrome DevTools Performance panel — you need to see the last LCP entry, not the first.
2. The Four-Phase Diagnostic Framework
This is the insight that separates competent LCP optimization from cargo-cult performance theater: LCP is not a single metric. It is the sum of four sequential sub-phases. Each phase has different root causes. Each requires completely different fixes. Treating LCP as one thing to “improve” leads to random image compression and crossed fingers.
Google’s engineering team, specifically Brendan Kenny’s analysis of CrUX data, confirmed what practitioners have suspected for years: TTFB is the single largest contributor to poor LCP scores. Sites with bad LCP spend an average of 2,270ms on TTFB alone — nearly the entire 2.5-second budget, before the browser has even started parsing HTML. If you’re compressing images on a site with 2.5-second TTFB, you are rearranging deck chairs.
Everything upstream of HTML delivery: DNS, TCP, TLS, redirects, server processing. The foundation. Nothing else is fixable if this is broken.
Time between TTFB completing and the browser starting to download the LCP element. The “discovery gap.” CSS background images and JS-rendered content live here.
Time to actually download the LCP resource — image bytes, font files, video poster. Pure file size and network speed problem. Solvable with format and compression optimization.
Time between the resource finishing download and actually painting on screen. CSS animations, opacity tricks, and main-thread blocking live here. The sneakiest phase.
3. Phase 1: TTFB — The Foundation Nobody Fixes First
I cannot tell you how many LCP audits I’ve seen where the recommendations were “compress your images” on a site with 2.8-second TTFB. It’s performance theater. As one practitioner’s guide articulates it clearly: you cannot optimize your way past your TTFB. If your server takes 1.5 seconds to respond, your LCP can never be faster than 1.5 seconds, no matter how small your WebP images are.
Google’s threshold for “good” TTFB is under 800ms. The true target is under 200ms for cached content. Here’s how to diagnose where your TTFB time is going:
Every HTTP→HTTPS redirect, www→non-www redirect, and trailing slash redirect is a full round trip. Identify chains in WebPageTest’s waterfall and eliminate them at the server level. A three-redirect chain on a 4G connection adds ~1 second before a single byte of your page is transferred.
On WordPress without page caching, every visitor triggers PHP execution, database queries, plugin hooks. Enable an object cache (Redis or Memcached) and a page cache (WP Rocket, W3 Total Cache, LiteSpeed Cache). The difference between uncached and cached TTFB on WordPress can be 1,200ms vs 80ms on the same server.
Light through fiber travels at roughly 200 km/millisecond. A user in Tokyo hitting a server in New York adds 25ms+ of pure physics each way — 50ms minimum round trip, and that’s before any packet loss or congestion. A CDN with 300+ edge nodes is not optional for international audiences; it’s physics compliance.
Cloudflare’s free tier enables HTTP/3 (QUIC) and supports HTTP 103 Early Hints, which let browsers begin fetching your LCP image and critical CSS while your origin is still generating the HTML response. These two features together can shave 200–400ms off LCP on uncached pages at zero cost. Enable both in Cloudflare Speed settings.
For a site targeting 2.5s LCP on mobile 4G (typical RTT: 150ms), here is a realistic TTFB budget breakdown. The LCP formula: LCP = TTFB + Resource Load Delay + Resource Load Duration + Render Delay. With a 2,500ms total budget: TTFB should ideally consume no more than 600ms. That leaves 1,900ms for phases 2–4. Given typical phase 2 (discovery delay ~100ms with preload), phase 3 (optimized WebP ~150ms on 4G with CDN), and phase 4 (near-zero with no animation tricks), you have comfortable margin. But if TTFB is 1,500ms — nearly any real-world scenario without caching — you have 1,000ms left for everything else, which is essentially impossible on 4G.
4. Phase 2: Resource Load Delay — The Invisible Killer
This is where most competent developers make their biggest mistake. Phase 2 measures the gap between TTFB completing and the browser starting to download the LCP element. It sounds like it should be near zero. It almost never is.
The root cause in 35% of cases, according to web.dev’s analysis, is that the LCP image URL is not discoverable in the initial HTML response. The browser’s preload scanner — which runs concurrently with HTML parsing to get ahead of resource requests — cannot find what isn’t there. Common culprits:
- CSS background-image (preload scanner blind)
- JavaScript-rendered hero images (need JS execution)
- Lazy-loaded hero images (
loading="lazy"on LCP element) - Image carousels where slide 1 is injected by JS
- Images in
data-srcattributes from old lazy-load libraries - React/Next.js default lazy behavior on non-priority images
<img src="...">in static HTML (scanner discovers immediately)<link rel="preload" as="image">in<head>fetchpriority="high"on the LCP img element- SSR/SSG frameworks that put img in initial HTML
- Next.js
priorityprop on Image component - Converting CSS bg-image to
<img>with absolute positioning
The Lazy Loading Trap — And Why Even Google Fell Into It
Here’s an embarrassing truth: Google’s own site, developers.google.com, was caught lazy-loading above-the-fold images due to its CMS applying loading="lazy" globally. Google engineer Martin Splitt addressed it directly on the Search Off the Record podcast, saying: “If you are using lazy loading on an image that is immediately visible, that is most likely going to have an impact on your largest contentful paint. It’s like almost guaranteed.”
The mechanism is damning: when the browser encounters loading="lazy", it deprioritizes the image entirely. It downloads CSS, JavaScript, fonts, and other assets first. By the time it finally gets around to the hero image, the bandwidth pipeline is full of competing requests. The hero image is the last thing in the viewport but the last thing to download.
According to web.dev’s analysis of real-user Chrome data, among pages with poor LCP, loading their LCP images is delayed by 1,290 milliseconds at the 75th percentile from client-side delays alone. That’s more than half the entire 2.5-second budget gone before a single byte of the image is downloaded.
For any <img> element that is your LCP candidate, the combination of removing loading="lazy" (or never adding it) and adding fetchpriority="high" is the single highest ROI intervention in all of LCP optimization. This is not an exaggeration. Google Flights added fetchpriority="high" to their hero image and saw LCP improve by 700ms — from 2.6 seconds to 1.9 seconds. One HTML attribute.
<!-- ❌ The classic mistake: lazy-loading the hero -->
<img src="hero.webp"
     loading="lazy" <!-- This is destroying your LCP -->
     alt="...">

<!-- ✅ The correct pattern for your LCP image -->
<img src="hero.webp"
     fetchpriority="high"
     decoding="async"
     width="1200"
     height="600"
     alt="...">

<!-- For CSS background images: convert to img + preload -->
<link rel="preload" as="image"
      href="hero.webp"
      fetchpriority="high">

<!-- IMPORTANT: preload solves discovery · fetchpriority solves priority -->
<!-- They do different things and you often need both -->
One critical nuance: preload and fetchpriority are not the same thing. Preload affects when the browser adds a resource to the download queue (early discovery). fetchpriority="high" affects the resource’s priority once it’s in the queue. For LCP images that are already in your HTML, fetchpriority="high" alone is often sufficient. For images discovered late — CSS backgrounds, JS-rendered content — you need the <link rel="preload"> in the head, plus fetchpriority="high" on both the preload link and the img element.
Preloading creates high-priority requests. If you preload 10 resources, none of them are actually prioritized — they all compete equally. Limit rel="preload" to 1–2 critical resources: your LCP image and possibly your most critical font. More than that and you’re diluting the priority signal the browser needs to make good decisions.
5. Phase 3: Resource Load Duration — Image Optimization That Actually Works
Phase 3 is the most well-documented phase in the “how to fix LCP” literature, which is why it’s the one everyone optimizes while ignoring phases 1 and 2. That said, it genuinely matters once those upstream phases are clean. A 1.2MB hero JPEG on 4G (typical mobile throughput: 7–10 Mbps) takes roughly 960ms–1,370ms to download. The same image at 120KB in AVIF takes 96ms–137ms. That’s a real difference.
Format Selection: The 2025 Reality
The AVIF vs. WebP debate has largely settled, but with nuance. AVIF offers 20–35% better compression than WebP at equivalent visual quality. But AVIF has a significant tradeoff: it is CPU-intensive to decode, and older mid-range Android devices can struggle with AVIF decoding fast enough for it to actually improve perceived performance. The recommendation from the Upward Engine analysis: use WebP for the LCP image on a broad target audience (95% browser support, faster decode); use AVIF for non-LCP images below the fold where decode time is less critical.
| Format | Browser Support | Compression vs. JPEG | Decode Speed | Best Use Case |
|---|---|---|---|---|
| AVIF | ~92% | 40–50% smaller | Slower (CPU-heavy) | Below-fold images, non-LCP elements |
| WebP | ~95% | 25–35% smaller | Fast | LCP images, hero elements, broad audience |
| JPEG | 100% | Baseline | Very fast | Fallback for <source> in <picture> |
| PNG | 100% | Often larger than JPEG | Fast | Transparency-required elements only |
Responsive Images: The Part Most Guides Skip
Your 1800px hero image is being downloaded in full on a 390px mobile screen. The effective size of that image on the screen is 390px × 2 (for retina) = 780px wide. You’re sending 1800 pixels to a 780-pixel slot, and the browser throws away 54% of the data before it even renders. This is where srcset and sizes attributes save real time:
<img
  src="hero-800.webp"
  srcset="hero-400.webp 400w,
          hero-800.webp 800w,
          hero-1200.webp 1200w,
          hero-1800.webp 1800w"
  sizes="(max-width: 640px) 100vw,
         (max-width: 1024px) 100vw,
         1200px"
  fetchpriority="high"
  decoding="async"
  width="1800" height="900"
  alt="Your hero alt text here"
>
Always include explicit width and height attributes. The browser uses the aspect ratio (not the absolute values) to reserve layout space before the image bytes arrive. Without them, every image on your page contributes to Cumulative Layout Shift as they load and the browser reflows content around them. CLS and LCP both tank simultaneously.
The Critical CSS Insight
Render-blocking CSS is a Phase 3 multiplier. The browser cannot render anything — including your LCP element — until it has parsed all CSS in the critical path. Large stylesheets from CDNs or monolithic CSS bundles act as a dam, holding back paint even after your LCP image has downloaded. The fix is inlining critical above-the-fold CSS directly in a <style> tag in the <head>, keeping it under 14KB so it fits within the first TCP packet, and loading the rest of your CSS asynchronously. Tools like Addy Osmani’s critical package automate this extraction. Eliminating unused CSS via Chrome DevTools’ Coverage tab has been shown to reduce LCP by an average of 19.66%.
6. Phase 4: Element Render Delay — The Animation Trap
This is the phase that bit me in 2023. Phase 4 measures the gap between an LCP resource finishing its download and the element actually painting on screen. In an ideal world this is near zero. In a world with JS-driven animations, CSS entrance effects, and “polish” that designers love, it can be 2+ seconds.
The core mechanism: Chrome does not count an element with opacity: 0 as an LCP candidate. The browser considers it invisible. It will wait until the element is repainted at any visible opacity before recording the LCP timestamp. This means any hero element that starts transparent and fades in — a very common design pattern — is delaying LCP by the entire duration of the fade-in delay plus transition time.
A documented real-world case: a choreographed entrance animation on an h1 — opacity starts at 0, filter: blur(12px), then transitions in on DOMContentLoaded via a JavaScript class toggle — pushed LCP from under 2 seconds to 5.3 seconds on that page. Three separate issues stacked: (1) opacity: 0 made the element invisible to LCP, (2) JavaScript had to execute before the class fired, (3) the animation transition itself added duration. The fix was setting initial opacity to 0.01 (visible to LCP, invisible to users) and using CSS animations instead of JS class toggling.
The elegant hack: opacity: 0.01. Any value above zero makes Chrome consider the element visible and eligible for LCP measurement. At 0.01 opacity, the element is practically invisible to the human eye but fully counted by the browser. This lets you preserve your animation while not delaying LCP measurement.
/* ❌ Kills LCP — Chrome ignores opacity: 0 elements */
.hero-title {
  opacity: 0;
  filter: blur(12px);
  transition: opacity 0.8s ease, filter 0.8s ease;
}
.hero-loaded .hero-title {
  opacity: 1;
  filter: none;
}

/* ✅ Design-preserving fix — 0.01 = invisible to users, visible to LCP */
.hero-title {
  opacity: 0.01; /* LCP can measure this */
  filter: blur(12px);
  animation: heroEntrance 0.8s ease 0.1s forwards;
}
@keyframes heroEntrance {
  to {
    opacity: 1;
    filter: none;
  }
}
Main thread blocking is the other major Phase 4 cause. If your JavaScript bundle is large and synchronous, the main thread is busy parsing and executing JS, which blocks compositing and painting. Even if the LCP image has fully downloaded, it cannot paint until the main thread is free. The solution is deferred and async loading of non-critical scripts, code splitting, and reducing third-party script weight. Every analytics pixel, chat widget, and A/B testing tool loaded synchronously in your head can add 50–300ms to Phase 4 on slow devices.
7. The Design vs. Performance Tension: A Practical Map
Here’s the conversation nobody wants to have directly. Some design choices are inherently hostile to LCP. Not theoretically — measurably, with milliseconds attached. A good performance engineer has to be able to have this conversation with designers without it becoming a fight. The key is never framing it as “performance vs. design” but as “here are three ways to keep your design intent and also not get penalized by Google.”
Video Backgrounds: The Hardest Design Conversation
Full-bleed autoplay video backgrounds are one of the more common “premium” design patterns, and they are almost universally terrible for LCP. Videos are large. Even a 10-second loop at reasonable quality is 3–8MB. Even on fast connections, video doesn’t benefit from the image-specific preloading mechanisms. And browser behavior is inconsistent: some browsers serve the first frame as an LCP candidate, others use the poster image, and the spec has evolved across Chrome versions.
The design-preserving compromise: use a static image (WebP, fully optimized, srcset-enabled) as the LCP element. Load the video asynchronously in the background. Once the video is ready, crossfade it in. This gives you your cinematic hero experience while the LCP measurement is captured on the fast-loading static image. The user still gets the video — just 1–2 seconds after the page feels loaded, which is often imperceptible.
Image Sliders and Carousels: Just… Don’t
Sliders are a design pattern that UX research has been killing for years (almost no users interact past slide 1), and from an LCP perspective they are hostile. The LCP element in a JS-driven carousel is typically not discoverable by the preload scanner, the first slide image is often lazy-loaded or injected by JavaScript, and slider plugins routinely ship 80–200KB of additional JavaScript that competes for main thread time. If your designer insists on a carousel, the fix is painful: server-render the first slide’s image as a static <img> element in HTML, load the slider plugin asynchronously after first paint, and accept that you’ve taken on a permanent performance maintenance burden.
8. Real Case Studies with Real Numbers
Google’s own Flights team ran a controlled optimization sprint focused on Core Web Vitals. The single most impactful change was adding fetchpriority="high" to the hero image of the page. No redesign. No image compression. No CDN changes. One HTML attribute.
Source: corewebvitals.io · Confirmed by web.dev documentation
Vodafone Italy ran a controlled experiment — a true A/B test, not a before/after analysis — optimizing their LCP through preloading the LCP image and reducing render-blocking resources. The revenue impact was measured directly against a control group, making this one of the cleanest LCP-to-revenue causal chains in the public literature.
Source: web.dev case study · Vodafone Italy
Agrofy, a Latin American agri-commerce marketplace, invested in a comprehensive LCP optimization effort including CDN migration, image optimization, and render-blocking resource elimination. The impact on load abandonment (visitors leaving before content appeared) was dramatic.
Source: Upward Engine analysis · Agrofy
“LCP is not a metric about images. It’s a metric about every decision made in your stack — hosting, caching, HTML structure, CSS architecture, JavaScript loading order, and animation philosophy — all arriving at a single number that determines whether you feel fast or broken.”
9. The LCP Cost Model: Calculating Your Revenue at Stake
The data connecting LCP to conversion is consistent enough to model, though with appropriate uncertainty bands. Based on documented case studies and the broader web performance literature, here is a conservative model for calculating revenue at risk from poor LCP:
Inputs needed: Monthly organic sessions, current conversion rate, average order value, current LCP at P75.
Conservative elasticity: Per the documented Vodafone A/B test (31% LCP → 8% sales lift) and broader literature (~5–10% conversion improvement per 1 second of load time improvement), a reasonable conservative estimate is 2–3% conversion improvement per 500ms LCP improvement.
Example calculation: Site with 100,000 monthly organic sessions, 2.5% conversion rate, $85 AOV, current LCP 4.2s.
Current monthly revenue: 100,000 × 2.5% × $85 = $212,500/month.
Fixing LCP from 4.2s to 1.9s = 2.3 seconds improvement = ~2 × 500ms brackets = 4–6% conversion lift (conservative).
Revenue uplift range: $8,500–$12,750/month. Annually: $102,000–$153,000.
These numbers are illustrative and your mileage will vary. But the directionality is reliable. And the cost of implementation is typically weeks of engineering time — not months.
10. The Unpopular Take: When LCP Optimization Is the Wrong Priority
I’ve spent 4,000+ words convincing you to fix LCP. Now let me walk that back slightly, because the opposite mistake — prioritizing LCP when something more fundamental is broken — is also real and common.
Martin Splitt at Google has publicly described Core Web Vitals, including LCP, as a “tiny minute factor” in ranking. That is not an excuse to ignore it, especially when other signals are equal between competitors. But it does mean that if you’re on page 3 of Google for your target keywords, fixing LCP from 3.2 to 2.1 seconds will not move you to page 1. It will not overcome content relevance problems, authority gaps, or thin page structures.
Where LCP genuinely matters as a competitive tiebreaker: you have strong content, reasonable authority, and you’re competing with 3–5 pages that are similar in quality on the SERP. In that scenario, Core Web Vitals can be the difference. For sites where LCP is 3.8 seconds and every competitor is also at 3.5–4.0 seconds, fixing it probably gives you a modest ranking edge. For a site with real content problems or link authority gaps — fix those first.
There’s also the issue of diminishing returns. Getting from 4.0s to 2.4s is the important move; it crosses the “good” threshold and captures the CrUX benefit. Getting from 2.4s to 1.6s is valuable for conversion rate, but the marginal SEO benefit is near-zero. Don’t spend four engineering sprints chasing a number that’s already good.
11. Measuring What Matters: Field Data vs. Lab Data
The distinction between field data and lab data is the most important and most ignored concept in LCP optimization. Lab data (Lighthouse, PageSpeed Insights lab mode, WebPageTest) simulates a single device and connection from a single location. Field data (CrUX, PageSpeed Insights field report, Search Console Core Web Vitals report) aggregates real user sessions across your actual traffic mix. Google uses field data for rankings. Lab data is useful for debugging. They are not the same thing.
| Tool | Data Type | Best For | Ranking Signal? |
|---|---|---|---|
| Google Search Console | Field (CrUX) | Tracking actual ranking signal · identifying pages that fail | Yes — this is what Google uses |
| PageSpeed Insights | Field + Lab | Both field (top) and lab (bottom) in one view | Field section yes |
| WebPageTest | Lab | Waterfall analysis · geographic testing · filmstrip debugging | No |
| Chrome DevTools | Lab | Phase-level debugging · JS profiling · coverage analysis | No |
| Lighthouse | Lab | Structured audit · finding specific issues | No |
The diagnostic workflow I use: start with Search Console Core Web Vitals report to understand which pages fail and whether the issue is device-specific. Then use PageSpeed Insights on the failing URLs to see the CrUX field breakdown and identify the dominant sub-phase. Then use WebPageTest with a throttled 4G connection and a Moto G4 device profile to reproduce the issue in lab conditions. Only then open Chrome DevTools to trace the specific waterfall and find the fixable root cause. This four-tool sequence takes maybe 30 minutes per URL and gives you a fully grounded diagnosis before writing a single line of code.
In Chrome DevTools Performance panel, after recording a load trace: look for the “LCP” annotation in the timeline. Click it. The panel will show you exactly which element was the LCP candidate, when it was discovered, when it started downloading, and when it painted. You can read phases 2, 3, and 4 directly off the timeline. Phase 1 (TTFB) appears as the gap before the first response in the Network tab waterfall. Together, you get the full four-phase breakdown in about 5 minutes.
12. The Complete LCP Fix Checklist
Run this in order. Phase 1 problems block everything else.
- Check Search Console Core Web Vitals report. Identify failing pages. Note whether mobile or desktop is the problem (usually mobile).
- Run PageSpeed Insights on the worst-performing URL. Look at the field data panel first. Note the dominant sub-phase.
- Measure TTFB using WebPageTest from a location representative of your users. If TTFB > 800ms: fix caching, switch to managed hosting, add CDN. Do not proceed to step 2 until TTFB < 600ms.
- Identify the LCP element using Chrome DevTools → Performance → LCP annotation. Is it an <img>, a CSS background, or a text element?
- If the LCP element is a CSS background-image: convert to <img> with absolute/relative positioning to preserve design. Add <link rel=”preload”> in <head>.
- Check for loading=”lazy” on the LCP element. Remove it immediately. Add fetchpriority=”high” to the LCP img tag and its preload link.
- Verify the LCP image URL appears in the static HTML response (not injected by JavaScript). Test with View Source, not DevTools Elements panel (which shows the DOM after JS execution).
- Convert LCP image to WebP. Use srcset with at least 3 breakpoints. Ensure file size under 150KB at 2x mobile resolution. Add explicit width and height attributes.
- Extract critical above-the-fold CSS and inline it in <head>. Keep under 14KB. Load remaining CSS asynchronously.
- Audit render-blocking scripts in <head>. Add defer or async to non-critical scripts. Eliminate any sync third-party scripts that aren’t essential for first paint.
- Check for opacity: 0 on any above-the-fold element, particularly the LCP candidate. Replace with opacity: 0.01 if animation is required.
- Profile JavaScript main thread usage during load. Any task over 50ms blocking the main thread during load contributes to render delay. Code-split, defer, or remove.
- Run WebPageTest again, measure LCP. Deploy to production. Wait 28 days for CrUX data to update. Check Search Console to confirm field data improvement.
The 3 AM Honest Summary
LCP is misunderstood in two opposite directions. Half the guides online treat it as an image compression problem. The other half bury you in abstract theory about browser rendering pipelines. Neither is what you need at 11pm when Google Search Console is showing red on your most important category pages.
What you actually need: a sequenced diagnostic. TTFB first — it’s the ceiling that can make everything else irrelevant. Resource load delay second — is your LCP image discoverable and prioritized? Resource load duration third — is it small and served fast? Render delay fourth — is anything blocking paint after the bytes have arrived?
The design vs. performance tension is real but overstated. You can have animated heroes that don’t break LCP. You can have beautiful images that load fast. You cannot have CSS background images as LCP elements and also good scores — that’s a genuine tradeoff. You cannot have carousels that JS-inject their first slide and also good scores — that’s another genuine tradeoff. Those are the conversations worth having with your design team.
Fix the TTFB. Add fetchpriority="high". Remove loading="lazy" from your hero. Convert your LCP image to WebP with srcset. Don’t use opacity: 0 on the element you want Chrome to count. That stack of changes — realistically 2–4 days of engineering work — will get most sites from poor to good.
And the next time your designer proposes a Ken Burns animation on the hero image with a JS class toggle, you’ll know exactly what to say.