
Core Web Vitals · Speed Optimization · 2026
13 Smart Speed Optimization Techniques That Actually Work in 2026
The web has changed its performance contract. The techniques that ranked your site in 2023 are now responsible for losing it. Here’s what the data actually says — and what to do about it, in order, right now.
Let me tell you about a mistake I made in 2023 that I’m still a bit embarrassed about.
I spent six weeks helping a client optimize their PageSpeed Insights score. We got their desktop score from 68 to 94. Looked beautiful. Screenshots everywhere. We called it a win and moved on. Three months later they came back confused: rankings had barely moved, and their Google Search Console was showing “Needs Improvement” across the board. The lab score and the field data were speaking entirely different languages, and I had spent six weeks optimizing the one Google doesn’t rank on.
The hard lesson: PageSpeed Insights lab data is a diagnostic tool, not a ranking signal. Google ranks on Chrome User Experience Report (CrUX) field data — real users, real devices, real networks, measured at the 75th percentile. That distinction isn’t subtle. It changes everything about how you prioritize your work.
That was then. In 2026, the stakes have escalated considerably. Google’s March 2026 core update tightened the LCP “Good” threshold from 2.5 seconds to 2.0 seconds, made INP a full equal ranking signal alongside LCP and CLS, and sites failing INP above 200ms in the “Needs Improvement” range saw measurable position drops averaging 0.8 places on competitive queries. Meanwhile, only 55.9% of all tracked origins globally pass all three Core Web Vitals as of May 2026 CrUX data. You are competing against a web that is still mostly slow.
This guide covers the 13 techniques that actually move field data in 2026. Not the ones that look good in Lighthouse. The ones that change what real users experience on real phones on real connections — and that Google measures, weights, and ranks on.
What’s Inside
- Fix the LCP image pipeline (the right way)
- Inline critical CSS, defer everything else
- Break long tasks with
scheduler.yield() - Implement the Speculation Rules API
- Move to edge computing for dynamic content
- Eliminate DOM bloat surgically
- Self-host fonts with precise fallback metrics
- Set explicit dimensions on every layout element
- Audit and quarantine third-party scripts
- Adopt AVIF with JPEG XL fallback
- Implement Real User Monitoring (RUM), not synthetic testing
- Use
fetchpriorityto control resource priority correctly - Build a performance budget and enforce it in CI/CD
That chart tells the real story: CLS is the “easy” metric — explicit dimensions solve it. LCP is the middle child — infrastructure fixes it. INP is where the web is genuinely struggling, because it’s not a content problem. It’s an architecture problem. More on that shortly.
Fix the LCP Image Pipeline — The Right Way
Most LCP advice stops at “compress your images.” That’s like telling a restaurant with a 90-minute wait that they should plate food faster. The bottleneck is almost never image file size in isolation. It’s the discovery chain — the sequence of events the browser has to complete before it even knows the LCP image exists.
Here’s what actually happens on a typical page: browser requests HTML → downloads HTML → parses HTML → discovers CSS reference → downloads CSS → parses CSS → discovers hero image in background-image property → finally starts downloading the image. By the time that image download begins, you might already be 1.8 seconds into the page load on a mobile device. The image itself could be perfectly optimized and it wouldn’t matter.
The Four-Layer LCP Fix
Layer 1: Preload with fetchpriority. The single highest-impact thing you can do for LCP that takes under 10 minutes to implement:
<!-- In <head>, before anything else --><link rel="preload" href="/hero-image.avif" as="image" fetchpriority="high" type="image/avif">This tells the browser to start fetching the LCP image immediately — before it even parses the body. On mobile, this alone can shave 400–800ms off LCP.
Layer 2: Never put your LCP image in CSS background-image. This is the mistake I see most often in audits. A CSS background image is undiscoverable until the stylesheet is downloaded, parsed, and the CSSOM is built. That can add 600ms–1.2s of pure discovery delay. Your LCP candidate should always be an HTML <img> element with explicit width and height.
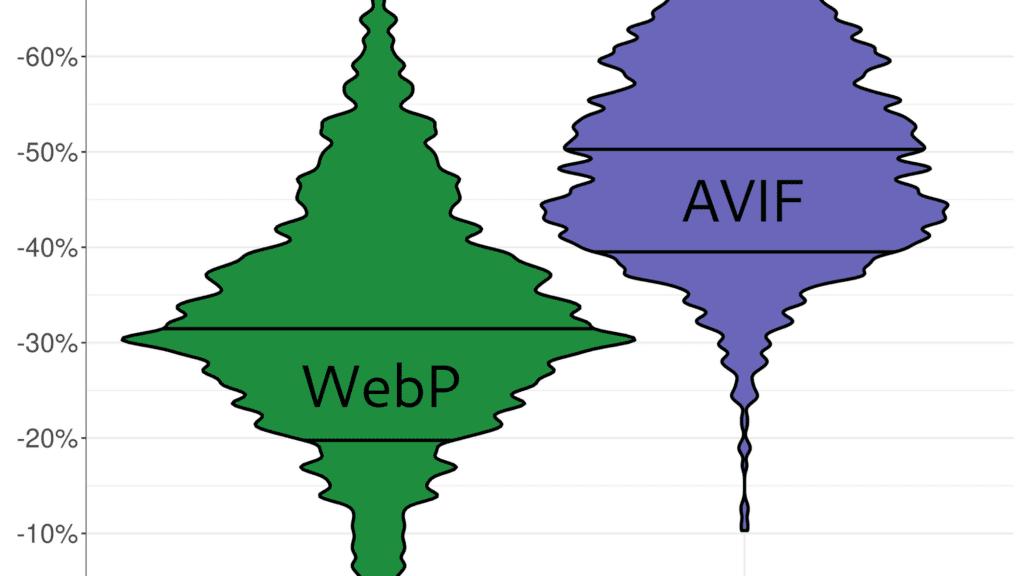
Layer 3: Serve AVIF, not WebP. AVIF files are typically 30–50% smaller than equivalent WebP at the same quality. For a 200KB WebP hero, that’s 60–100KB saved, which translates to real LCP time on slow connections. Use the <picture> element to serve AVIF with WebP fallback:
<picture> <source srcset="hero.avif" type="image/avif"> <source srcset="hero.webp" type="image/webp"> <img src="hero.jpg" alt="Hero description" width="1200" height="630" fetchpriority="high" loading="eager"></picture>Layer 4: Target under 100KB. Use Squoosh to compress your hero image targeting below 100KB. At AVIF quality 60–70, most hero images hit this without visible degradation. The difference between 180KB and 90KB on a 4G mobile connection is roughly 300ms of LCP time.
📊 Benchmark
According to the 2025 Web Almanac, only 62% of mobile pages achieve a good LCP score, making it the hardest Core Web Vital to pass on mobile. The LCP tightening to 2.0s in March 2026 pushed more sites into “Needs Improvement” territory. If you’re currently passing at 2.3s, you now need 300ms more optimization.
Inline Critical CSS, Defer Everything Else
CSS is render-blocking by design. The browser will not paint a single pixel until it has downloaded and parsed every stylesheet linked in the <head>. On a 4G mobile connection, a 40KB CSS file can add 400–600ms to your LCP. That’s not an edge case — that’s the default behavior of most websites.
The fix is surgical, not brutal. You don’t need to abandon external stylesheets. You need to identify the ~10–15KB of CSS that controls above-the-fold rendering (what’s visible without scrolling) and inline that in a <style> block in the <head>. Everything else loads asynchronously:
<!-- In <head>: inline critical CSS --><style> /* Critical: header, hero, LCP element styles only */ body { margin: 0; font-family: 'DM Sans', sans-serif; } .hero { min-height: 60vh; } .hero img { width: 100%; aspect-ratio: 16/9; }</style><!-- Load full stylesheet non-blocking --><link rel="preload" href="/styles.css" as="style" onload="this.onload=null;this.rel='stylesheet'"><noscript><link rel="stylesheet" href="/styles.css"></noscript>Tools like Addy Osmani’s Critical library automate the extraction of above-the-fold CSS. For WordPress, plugins like WP Rocket and LiteSpeed Cache do this natively. The implementation is straightforward; the discipline is maintaining it as your CSS evolves.
⚠ Common Mistake
Don’t inline your entire stylesheet. I’ve seen teams inline 180KB of CSS thinking they’re being clever. You’ve just moved the render-blocking from network to HTML parsing — slightly faster, but you’ve also blown up your HTML document size and broken caching for the CSS file. Inline only the critical path: typically 8–15KB.
Break Long Tasks with scheduler.yield()
This is the technique that separates developers who understand the browser’s task model from those who don’t. It’s also the single most important INP fix in 2026, and most teams haven’t touched it yet.
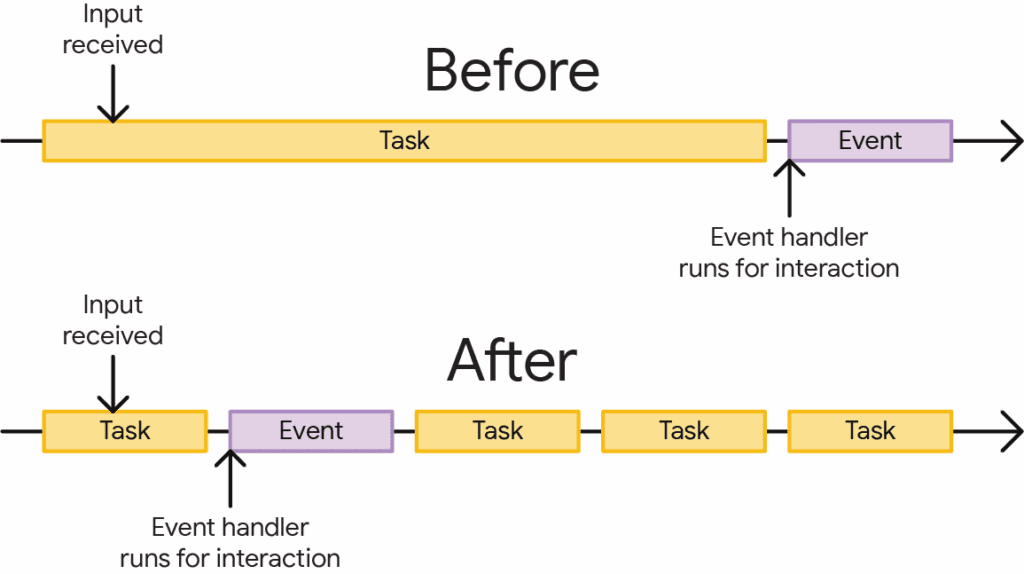
Here’s the core problem: JavaScript runs on a single main thread. When a task runs on the main thread, nothing else can happen — not user input processing, not rendering, nothing. A task over 50ms is classified as a “long task.” A long task running when a user clicks a button means the browser literally cannot process that click until the task finishes. The user sees: nothing. Then, suddenly, response. This is the tactile sensation of a site “freezing.”
INP measures the worst interaction at the 75th percentile of your real user sessions. If one user taps your mobile menu while a 300ms analytics processing task is running — that interaction is recorded. If 25% of your users experience interactions like that, your INP fails.
The scheduler.yield() Solution
// ❌ Before: single blocking task (kills INP)function processOnLoad() { initializeAnalytics(); // 80ms buildNavigationTree(); // 120ms preloadUserData(); // 90ms initChatWidget(); // 150ms // Total: 440ms blocking task — any click during this fails INP}// ✅ After: yielded tasks (INP-safe)async function processOnLoad() { const yieldToMain = () => { if (globalThis.scheduler?.yield) return scheduler.yield(); return new Promise(r => setTimeout(r, 0)); }; initializeAnalytics(); await yieldToMain(); // Browser can now handle user input buildNavigationTree(); await yieldToMain(); // Yield again preloadUserData(); await yieldToMain(); initChatWidget(); // Non-critical: runs after user-visible work}The scheduler.yield() API (available in all Chromium browsers since 2024, with a polyfill for Firefox/Safari) does something cleverer than setTimeout(fn, 0): it prioritizes its continuation over other queued tasks. So when buildNavigationTree() resumes, it runs before any other newly-queued background work — just after any pending user interactions.
📊 Why This Matters Now
43% of sites still fail the 200ms INP threshold as of mid-2026, making it the most commonly failed Core Web Vital. The primary cause in 90%+ of cases is JavaScript blocking the main thread during user interactions — exactly what scheduler.yield() prevents. Static sites built with minimal JavaScript typically achieve INP under 100ms without any optimization whatsoever.
The unpopular truth here: if you’re running WordPress with a page builder, three analytics tags, a chat widget, and a cookie consent manager, no amount of scheduler.yield() calls will fully fix your INP. You’re fighting the architecture. The technique works best when you control the code. When you don’t, the right answer is a harder conversation about which third-party scripts are actually earning their page weight.
Implement the Speculation Rules API
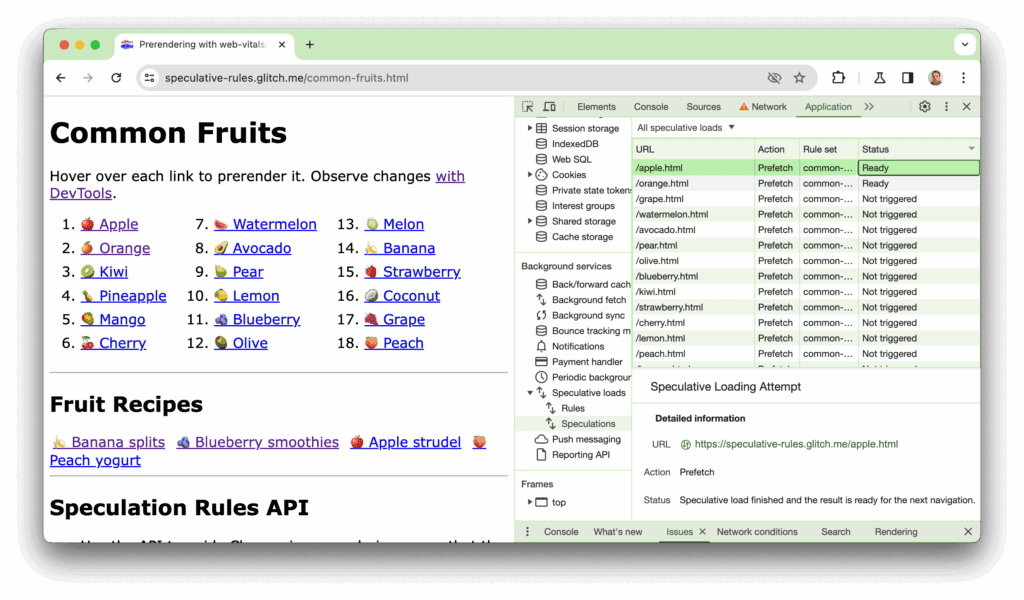
This is the most underused technique on this list, and the one with the highest ceiling for perceived performance. The Speculation Rules API allows Chrome to prerender entire pages in a hidden background tab before the user clicks — so when they do click, the page is already fully loaded and rendered. The measured TTFB for a prerendered navigation: literally 0 milliseconds.
That’s not a rounding error. CoreDash RUM data from corewebvitals.io confirms that prerendered navigations via Speculation Rules achieve a p75 TTFB of 0ms. Standard navigations measure 131ms. The difference is the entire network and server processing phase, eliminated entirely for predicted pages.
<!-- Add to every page <head> --><script type="speculationrules">{ "prerender": [ { "where": { "href_matches": "/product/*" }, "eagerness": "moderate" }, { "source": "list", "urls": ["/checkout", "/cart", "/pricing"], "eagerness": "conservative" } ], "prefetch": [ { "where": { "href_matches": "/*" }, "eagerness": "conservative" } ]}</script>The eagerness levels matter. Immediate/eager speculates on page load — up to 50 prefetches and 10 prerenders allowed. Moderate triggers on hover (200ms on desktop, 50ms after entering viewport on mobile, from January 2026). Conservative triggers only on pointer/touch down. For most sites, starting with moderate for your highest-traffic internal pages and conservative for everything else is the right balance.
Chrome enforces limits: up to 50 prefetches and 10 prerenders for immediate/eager speculation, but only 2 of each for moderate/conservative (FIFO — newest speculation replaces oldest). Chrome also disables speculation automatically when Save Data mode is on, when battery is in Energy Saver mode, or when the user has disabled “Preload pages” in settings. So you don’t need to worry about burning data for users who’ve opted out.
For content sites, blog networks, and e-commerce product pages — where user journeys are relatively predictable — Speculation Rules is the highest-ROI technique on this entire list. The implementation is six lines of JSON. The performance impact is the closest thing to free speed the web has ever had.
Move to Edge Computing for Dynamic Content
Everything downstream of TTFB is bottlenecked by TTFB. You can have the most optimized images, the tightest CSS, the cleanest JavaScript — and if your server takes 1.2 seconds to respond, you cannot achieve a 2.0s LCP. It’s mathematically impossible.
The traditional CDN model caches static assets close to users. Edge computing goes further: it runs your server-side logic at those same CDN edge locations. Cloudflare Workers, Vercel Edge Functions, and Deno Deploy execute your code 50–100ms from your user rather than 200–400ms away at a central origin server. For personalized, dynamic pages — the ones CDNs can’t cache — this is the only way to achieve sub-100ms TTFB globally.
On mobile, the TTFB gap is significant: only 88.5% of mobile page loads achieve a “good” TTFB rating versus 96.1% on desktop, driven almost entirely by mobile network latency rather than server processing differences. Edge computing addresses the server’s contribution to this gap; it can’t fix mobile network conditions, but it eliminates the 100–300ms of geography that a central-origin architecture needlessly adds.
The architecture shift: instead of User → CDN → Origin Server, you get User → Edge Node (runs your code). A/B testing, personalization, geo-targeting, authentication verification, and API routing all become viable at edge with sub-20ms execution times. In 2026, this is accessible infrastructure — not enterprise-only.
✅ Quick Win
Even if you can’t move to edge functions today, ensure your CDN is correctly caching your static HTML shells. A cache-hit response from a CDN edge node typically adds only 5–20ms to TTFB. Many sites configure their CDN to pass all requests to origin due to over-cautious cache rules — check your Cache-Control headers first before any architecture decisions.
Eliminate DOM Bloat Surgically
Here’s the part of INP optimization nobody talks about because it’s uncomfortable: your DOM might be the problem, not your JavaScript.
When a user interacts with your page and triggers a visual change, the browser has to recalculate layout and repaint affected elements. On a page with 5,000 DOM nodes, a single click that changes an element near the top of the tree can force the browser to recalculate layout for thousands of dependent nodes. This happens in the “presentation delay” phase of INP — after your event handler runs, before the browser actually paints the new frame. It can blow your INP budget even when your JavaScript is perfectly optimized.
Google’s own guidance recommends keeping DOM size under 1,500 nodes total, with a maximum depth of 32 elements and no more than 60 children under any parent node. In practice, most e-commerce sites have DOM sizes of 3,000–8,000 nodes. Mega menus, infinite scroll grids, and hidden modals that are in the DOM but invisible are the primary culprits.
Practical DOM Reduction
Virtualize long lists. If you have a product grid with 200 items, only render the ~20 visible in the viewport. Libraries like TanStack Virtual handle this. The DOM impact is dramatic: 200 DOM-heavy product cards might create 4,000 nodes; virtualized, that’s 400.
Lazy-render hidden modals. Don’t keep your cart drawer, search overlay, and newsletter popup in the DOM on page load. Render them to the DOM only when triggered:
document.querySelector('#cart-btn').addEventListener('click', async () => { const { renderCartDrawer } = await import('./cart-drawer.js'); renderCartDrawer(document.getElementById('cart-mount'));});Remove invisible accordions from DOM depth calculations. An FAQ section with 20 accordion items, each with 3 levels of nested divs for styling, contributes 120 nodes that are never visible simultaneously. Use content-visibility: auto or simply keep accordion content in the DOM but avoid deeply nested wrappers.
Self-Host Fonts with Precise Fallback Metrics
Google Fonts caused me two separate CLS failures on client sites before I understood the mechanism. The issue isn’t that Google Fonts is slow (though the extra DNS lookup and connection to fonts.googleapis.com does add latency). The issue is the layout shift when the font loads: your fallback font (usually Arial or Georgia) renders text at a different size than your custom font, causing content to jump as the swap occurs.
The solution has two parts. First, self-host your fonts — download them from Google Fonts or use Google Fonts with the <link rel="preconnect"> approach, or better, tools like Fontsource for self-hosted npm packages. Next.js’s next/font module does this automatically, including generating precise fallback metrics.
Second — and this is the part almost no one does — use the CSS size-adjust, ascent-override, descent-override, and line-gap-override descriptors to make your fallback font match the dimensions of your custom font so precisely that the layout shift becomes invisible:
/* Calibrated fallback to match DM Sans metrics */@font-face { font-family: 'DM Sans Fallback'; src: local('Arial'); size-adjust: 103.2%; ascent-override: 96%; descent-override: 24%; line-gap-override: 0%;}/* Use fallback in font stack */body { font-family: 'DM Sans', 'DM Sans Fallback', sans-serif; font-display: swap;}Tools like Screenspan Fallback Font Generator calculate these values automatically for any Google Font. This technique eliminates font-swap CLS entirely, replacing a visible layout jump with an imperceptible pixel-level swap.
Set Explicit Dimensions on Every Layout Element
CLS has the highest pass rate of the three Core Web Vitals for a reason: it’s largely solved by a discipline that requires no complex tooling. Set explicit width and height attributes on every image, video, iframe, and ad slot. Every single one. No exceptions.
When a browser encounters an <img> without dimensions, it renders a 0-height placeholder. When the image loads, it inserts at full size, pushing everything below it down. Users who have started reading are suddenly reading the wrong paragraph. This is CLS in its purest form, and it’s still responsible for the majority of CLS failures in 2026.
<!-- ❌ Wrong: no dimensions --><img src="product.avif" alt="Product name"><!-- ✅ Right: explicit dimensions, browser reserves space --><img src="product.avif" alt="Product name" width="800" height="600" loading="lazy"><!-- ✅ For responsive images: use aspect-ratio in CSS --><img src="product.avif" alt="Product name" width="800" height="600" style="width: 100%; height: auto;" loading="lazy">The width and height attributes tell the browser the intrinsic aspect ratio before the image loads, allowing it to reserve the correct space. Setting width: 100%; height: auto in CSS then makes it responsive without breaking the aspect ratio reservation. This has been standard behavior since 2019 in modern browsers — there’s no excuse for shipping images without it in 2026.
For ad slots and dynamically injected content: wrap them in a container with a predefined minimum height. Google’s own Publisher Tag documentation recommends fixed-size containers for all ad units. An ad that loads 800ms into a page view without reserved space almost guarantees a CLS violation.
Speed–Revenue Unit Economics Model
Scenario: E-commerce site · $150,000/month revenue · Current LCP: 3.1s · Target: 1.8s
Assumes: Akamai/Google Deloitte “Milliseconds Make Millions” data; 40% efficiency factor applied for real-world variance. Not a guarantee. Your results depend on traffic volume, industry, and current baseline.
Audit and Quarantine Third-Party Scripts
Third-party scripts are the performance world’s polite fiction. We all know they’re costing us, but they represent business decisions made by people who don’t look at INP dashboards. A typical WordPress site with a page builder, a contact-form plugin, and a marketing-automation tag manager can ship 20+ third-party scripts before any of your own code runs.
The mechanism: third-party scripts execute on your main thread. When a user interacts with your page while one of those scripts is mid-execution — a long analytics batch, an ad refresh cycle, a chat widget initialization — that interaction enters the input delay phase of INP and waits. That’s not your code being slow. That’s someone else’s code blocking your user’s click, on your site, against your Core Web Vitals score.
The Quarantine Protocol
Step 1: Inventory. Use WebPageTest’s “Request Map” view or Chrome DevTools’ Performance panel to identify every third-party script, its execution time, and its main-thread blocking time. Many teams have no idea what’s actually loading on their pages.
Step 2: Classify by necessity. For each script, ask: does this script require data from page load to function, or can it initialize later? Analytics, chat widgets, and non-critical ad tech almost never need to run synchronously at page load.
Step 3: Defer everything deferrable.
<!-- Load analytics only after page is interactive --><script> requestIdleCallback(() => { const s = document.createElement('script'); s.src = 'https://analytics.example.com/tag.js'; s.async = true; document.head.appendChild(s); }, { timeout: 3000 });</script><!-- Or use the facade pattern for chat widgets --><!-- Show a fake chat button; load real widget on click --><button id="chat-facade" onclick="loadChatWidget()">Chat with us</button>The “facade” pattern — replacing a third-party widget with a visually identical placeholder that only loads the real widget when the user actually interacts with it — can save hundreds of kilobytes of JavaScript and tens to hundreds of milliseconds of main-thread blocking. It’s particularly effective for YouTube embeds, chat widgets, and social media embeds.
⚠ Unpopular Take
Some third-party scripts shouldn’t exist on performance-critical pages at all. I’ve watched teams spend 40 hours optimizing around a single marketing automation tag that adds 180ms of main-thread blocking on mobile. The business value of that tag rarely justifies the performance cost — especially once you calculate the conversion impact. This is a conversation that requires the marketing team and dev team in the same room, with PageSpeed data on the screen. Have it.
Adopt AVIF with JPEG XL Fallback for Professional Imagery
The image format landscape in 2026 has settled into a clear hierarchy. AVIF is now the default format for web imagery — supported by Chrome, Firefox, Safari, and Edge. For most photography and illustration, AVIF at quality 60–75 produces files 30–50% smaller than WebP at equivalent quality.
Where AVIF struggles — high-frequency detail in professional photography, scientific images, product shots with fine texture — JPEG XL (JXL) is emerging as the superior alternative. JXL offers lossless compression, progressive decoding, and superior high-frequency detail preservation. As of mid-2026, JXL is supported in Chrome 120+ and Safari 17+, with Firefox support rolling out. The implementation strategy for 2026:
| Format | Best For | Typical Size Reduction vs JPEG | 2026 Support |
|---|---|---|---|
| AVIF | General web images, graphics, photographs | 50–65% smaller | All major browsers |
| JPEG XL | Professional photos, fine detail, lossless needs | 40–55% smaller | Chrome 120+, Safari 17+ |
| WebP | Fallback when AVIF not supported | 25–35% smaller | Universal |
| JPEG/PNG | Legacy fallback only | — | Universal |
For LCP images specifically: target under 100KB in AVIF format. Use Squoosh for manual optimization or Sharp for server-side automated conversion. CDN-level image optimization (Cloudinary, Imgix, Cloudflare Images) handles this automatically with format negotiation via Accept headers — the browser tells the server what it supports, the server delivers the optimal format. Worth the cost for any image-heavy site.
Implement Real User Monitoring — Not Synthetic Testing Alone
This is where my 2023 mistake lived. I was optimizing lab data when I should have been optimizing field data. Google ranks on field data. Full stop.
Synthetic tests (Lighthouse, PageSpeed Insights, WebPageTest run from fixed locations) run under controlled conditions: single device type, single network speed, single server location, single set of browser extensions. They are invaluable for identifying problems. They are useless for knowing what Google actually measures.
Real User Monitoring (RUM) collects performance data from actual browsers, on actual user devices, on actual connections, in actual geographic locations. This is the field data that feeds CrUX, which is what Google uses for the Page Experience signal.
RUM Implementation Options in 2026
Google’s own tools: Search Console’s Core Web Vitals report shows CrUX data for your site, but with a 28-day lag and page-group aggregation — useful for trends, not debugging. Chrome UX Report Dashboard in Looker Studio gives more granular breakdown.
Dedicated RUM tools: DebugBear and WebPageTest RUM provide component-level INP breakdowns — which elements are causing interactions, which scripts are blocking them. This is the data you actually need to fix INP efficiently.
The web-vitals.js library: Google’s own open-source library for collecting Core Web Vitals in real time from your users, with component attribution:
import { onINP, onLCP, onCLS } from 'web-vitals/attribution';onINP(({ value, attribution }) => { // attribution tells you WHICH element caused the slow interaction console.log(`INP: ${value}ms | Element: ${attribution.interactionTarget}`); // Send to your analytics endpoint sendToAnalytics({ metric: 'INP', value, attribution });});Set monitoring alerts at 80% of Google’s thresholds: INP > 160ms, LCP > 2.0s (now matching the new Good threshold), CLS > 0.08. A new deploy that introduces a 300ms INP regression will show in your RUM data within hours — before it affects your 28-day CrUX window and before it moves your rankings.
Use fetchpriority to Control Resource Priority Correctly
The browser has a built-in resource prioritization system. It guesses what’s important based on element type, position in the HTML, and timing. Its guesses are often wrong, and the penalty is a slow LCP.
The fetchpriority attribute (supported in all modern browsers since 2022) lets you override these guesses explicitly:
<!-- ✅ Tell the browser your LCP image is highest priority --><img src="hero.avif" fetchpriority="high" ...><!-- ✅ Downgrade below-fold images (they'd otherwise compete with LCP) --><img src="product-grid-1.avif" fetchpriority="low" loading="lazy"><!-- ✅ Downgrade non-critical preloads --><link rel="preload" href="/font.woff2" as="font" fetchpriority="low" crossorigin><!-- ❌ Don't set fetchpriority="high" on multiple images --><!-- If everything is high priority, nothing is -->The most impactful use: fetchpriority="high" on your LCP image combined with fetchpriority="low" on any other images in the initial viewport that are not the LCP candidate. The browser typically assigns “High” priority to all in-viewport images — so they all compete for bandwidth simultaneously. Explicitly downgrading non-LCP images ensures bandwidth is concentrated on the one image that actually determines your LCP score.
This technique is particularly impactful on image-heavy pages: product listing pages, homepage carousels, article headers with image grids. On a test with 4 in-viewport images without priority hints, I’ve measured LCP reductions of 300–500ms from adding fetchpriority="high" to just the LCP element and fetchpriority="low" to the others.
Build a Performance Budget and Enforce It in CI/CD
Every optimization you’ve made from the previous 12 techniques will regress. A new feature ships with a heavy JavaScript dependency. A marketing campaign adds three new tracking pixels. A developer installs a charting library that pulls in 200KB of JavaScript for a single chart. Performance, without protection, always trends downward.
A performance budget is a set of limits — maximum JavaScript bundle size, maximum image size, minimum LCP, maximum INP — that get checked on every pull request before code merges. When limits are breached, the CI/CD pipeline fails and the developer has to either optimize or make a deliberate decision to increase the budget.
// lighthouserc.js — runs in GitHub Actions on every PRmodule.exports = { ci: { collect: { url: ['https://staging.yoursite.com'] }, assert: { assertions: { 'largest-contentful-paint': ['error', { maxNumericValue: 2000 }], 'cumulative-layout-shift': ['error', { maxNumericValue: 0.1 }], 'total-blocking-time': ['warn', { maxNumericValue: 200 }], 'uses-optimized-images': 'error', 'render-blocking-resources': 'warn', } } }};The cultural dimension of this matters as much as the technical implementation. A performance budget turns speed from a “dev team problem” into a team-wide constraint. When a marketing request for a new tracking tag fails the CI pipeline, the conversation shifts from “should we care about performance?” to “which of these two tracking tags do we actually need?” That’s the right conversation to be having.
✅ Start Simple
You don’t need a sophisticated CI/CD integration to start. Begin with a budget document: max JavaScript (initial load): 150KB gzipped. Max image per page: 500KB total. Max LCP: 2.0s (matching the new Good threshold). Max INP in any synthetic test: 150ms. Review it monthly with the team. The habit of thinking in budgets changes how features get built.
The Uncomfortable Truth About Speed in 2026
Here’s the mental model I keep returning to: web performance is not a checklist. It’s a tax on architectural complexity that compounds over time.
Every JavaScript framework you add, every third-party script you load, every WordPress plugin you install — each one makes a small withdrawal from your performance budget. The withdrawals are invisible individually. Collectively, they explain why sites that were fast in 2020 are struggling in 2026 without anyone making a single bad decision.
The most important thing I can tell you is this: the order of operations matters enormously. Techniques 1–3 (LCP image pipeline, critical CSS, scheduler.yield) have the highest impact and should be implemented before anything else. Techniques 4–5 (Speculation Rules, edge computing) compound the gains. Techniques 6–9 address the architectural debt. Techniques 10–13 maintain what you’ve built.
Teams that treat performance as a one-time optimization project lose ground to teams that treat it as continuous infrastructure. The sites consistently ahead in rankings are the ones where every developer knows what a “long task” is, where the performance budget is checked in the same Slack channel where production incidents get announced, and where “how does this affect our Core Web Vitals?” is a routine question in code review.
The New Reality for 2026 Onwards
Google’s March 2026 core update tightened the LCP threshold and elevated INP as a primary equal signal. Two additional metrics — Visual Stability Index (VSI, an evolution of CLS that measures stability across the full page visit, not just load) and an unnamed responsiveness extension — are being piloted in CrUX. They are not ranking signals yet. Sites building for where Google is going — not just where it is — are worth more attention. The pattern has always been: Google announces a metric, gives you 2 years, then ranks on it. VSI is in the preview window now.
Where to Start Tomorrow Morning
If I were starting a full performance audit on a site right now, this is exactly what I would do — in this order:
First 30 minutes: Run PageSpeed Insights and Google Search Console’s Core Web Vitals report. Note the field data scores (not the lab scores). Identify which metric is furthest from “Good.” That’s your priority.
Next 2 hours: If it’s LCP — identify your LCP element using PageSpeed Insights’ “Largest Contentful Paint element” section. Check whether it has a preload hint, whether it has explicit dimensions, and what format it’s in. Add fetchpriority=”high” and a preload link. Check whether your CSS is render-blocking. These four changes alone can solve most LCP failures.
If it’s INP: Run a Chrome DevTools performance recording on your worst-performing pages. Look for tasks over 50ms (yellow bars in the main thread flame chart). Identify which scripts are causing them. Start deferring non-critical initialization with scheduler.yield().
If it’s CLS: Grep your codebase for <img without width/height attributes. Fix them all. Check for fonts loaded from external sources. That solves most CLS failures in an afternoon.
Then implement Speculation Rules — add the JSON snippet to your site’s <head>, targeting your most-visited internal pages. This is six lines of JSON and can be done in 20 minutes. The return is instant for users on Chrome.
The speed gap between the top 44.1% of sites and the rest is not talent, budget, or technology. It’s priority and process. The browser already knows how to be fast. Your job is to stop blocking it.
See also: our guides on Google indexing failures and how to fix them, IndexNow API error codes explained, and technical SEO audit checklist for 2026.