
A Step-by-Step Framework for
Fixing Page Speed Issues
Across Any Website
Most speed guides tell you to compress your images. This one tells you why that’s often the last thing you should do—and gives you a triage system that works whether you’re running a bare WordPress blog or a 10,000-SKU ecommerce platform.
Let me tell you about a mistake I made with a client’s site in 2024 that still bothers me. We’d run PageSpeed Insights, seen the “compress your images” recommendation sitting there at the top, and dutifully ran every image through a WebP conversion pipeline. The LCP score barely moved. Spent two weeks on it. Two weeks.
Turned out the real bottleneck was a 560ms TTFB caused by a shared-hosting plan with no server-side caching. The images were almost irrelevant. The server was answering every request cold, from scratch, on a machine it was sharing with 400 other websites. We could have compressed every byte to nothing and it wouldn’t have fixed the fundamental problem: the server was slow, so the LCP had to be slow.
This guide exists because of that mistake—and because I see the same mistake made, in different forms, on almost every site audit I run. The tools tell you what to fix. Almost nobody tells you why the order matters. And the order? It matters enormously.
// contextThe Stakes in 2026: What Slow Actually Costs
Before we get into the framework, you need to understand what we’re actually fighting for. Because “fix your Core Web Vitals” sounds like a technical checkbox, and it isn’t.
The numbers are not hypothetical. A 1-second delay in page response carries a ~7% reduction in conversions, a figure documented by Akamai across thousands of sites. At Amazon’s scale, their own research found every 100ms of latency cost 1% of sales—a ratio that, applied to their 2025 revenue, implies $5.7 billion lost per unnecessary tenth of a second. Your site isn’t Amazon. But the percentage math is the same.
That 55.9% figure deserves a moment of attention. Nearly half of all websites on the internet fail Google’s Core Web Vitals thresholds. This is the state of play after five years of industry focus on the problem. And Google has made it unmistakably clear that in competitive SERPs, when two pages have comparable content quality, the faster one wins. That’s the tiebreaker. In 2026, the tiebreaker is being invoked constantly.
Following the March 2026 core update, pages in position 1 show a 10% higher Core Web Vitals pass rate than pages in position 9. When two pages are otherwise competitive on content, Core Web Vitals can be exactly what separates page one from page two. The tiebreaker is real and it’s measurable.
There’s also the AI Overviews dimension now. Fast, well-structured sites are being cited in AI-generated search responses at meaningfully higher rates. It’s not a confirmed published factor yet—but the directional evidence is consistent enough that slow sites are losing twice: once in organic rankings, again in AI citation visibility.
// frameworkThe Diagnostic Chain: Why Order Matters More Than You Think
Here’s the insight that changed how I approach every audit: page speed problems are downstream of each other. You cannot fix LCP if TTFB is broken. You cannot meaningfully fix INP if you haven’t handled JavaScript architecture. You cannot fix CLS if you haven’t resolved font and image layout shifts first.
The performance optimization space is flooded with advice that treats every fix as equally valuable, equally independent, and equally urgent. It is not. Fixing INP before fixing a 900ms TTFB is like tuning a car’s exhaust while the engine is misfiring.
The chain works like this: TTFB is the floor for LCP. If your server takes 600ms to respond, your LCP can never be below 600ms — plus the download time of the LCP resource. A slow server makes every other optimization a band-aid. Then, render-path issues (LCP) and JavaScript architecture (which affects INP) can be tackled in parallel once the server foundation is solid. CLS comes last because fixing it requires knowing that your fonts, images, and dynamic elements are already loading in a stable, predictable way.
// step 01Establish a Measurement Baseline
You cannot optimize what you cannot measure. And you need to understand the difference between two fundamentally different types of measurement before you do anything else.
Lab Data vs. Field Data: Not the Same Thing
Lab data (Lighthouse, PageSpeed Insights “Diagnostics”) simulates a page load under controlled conditions — a specific device profile, a specific network throttle, a specific geographic location. It’s deterministic and reproducible, which makes it useful for identifying individual issues. But it doesn’t tell you how real users experience your site.
Field data (CrUX, Google Search Console CWV report) is measured from actual Chrome users visiting your actual URLs, over a 28-day rolling window. This is what Google uses for ranking. If your field data is bad, you have a ranking problem. If only your lab data is bad, you have an optimization opportunity but not necessarily a ranking crisis—yet.
The most common mistake in page speed audits: treating a Lighthouse score of 45 as an emergency when your Search Console shows 90% of URLs as “Good”. The Lighthouse score measures a simulation; the Search Console report measures reality.
Your Baseline Measurement Stack
Use all three of these, in this order, before touching a single optimization:
- Google Search Console → Core Web Vitals report — Start here. It shows field data for your actual URLs grouped by status (Good / Needs Improvement / Poor) and broken down by device. This is the ground truth for whether you have a ranking problem.
- PageSpeed Insights — Shows both field data (where available) and lab diagnostics for individual URLs. Critical for triage: it tells you which specific element is the LCP candidate and gives you the attribution breakdown.
- Chrome DevTools → Performance panel — For deep INP and long-task diagnosis. Nothing else gives you the full main thread execution trace.
Audit at minimum five URLs: your homepage, your two highest-traffic content pages, your most important conversion page (product, pricing, contact), and one “deep” URL that’s representative of templated content (a category page, a blog post). The homepage is often an outlier — it carries the heaviest hero media — so benchmarking only the homepage will mislead you about the overall site health.
Secondary pages consistently outperform home pages on Core Web Vitals: 61% vs. 47% desktop pass rate, and 56% vs. 45% on mobile (2025 Web Almanac). When you benchmark, compare like with like. Don’t average your home page score with your blog post scores — they’re different animals.
The Metrics to Track (and What “Good” Means in 2026)
| Metric | What It Measures | Good | Needs Work | Poor | Ranking Signal |
|---|---|---|---|---|---|
| LCP Largest Contentful Paint | Time until the largest visible element renders | < 2.5s | 2.5–4.0s | > 4.0s | Primary ✓ |
| INP Interaction to Next Paint | Worst interaction latency across the full session | < 200ms | 200–500ms | > 500ms | Primary ✓ (since Mar 2024) |
| CLS Cumulative Layout Shift | Total unexpected visual shift during page lifecycle | < 0.1 | 0.1–0.25 | > 0.25 | Primary ✓ |
| TTFB Time to First Byte | Server response time | < 200ms | 200–500ms | > 500ms | Diagnostic (LCP floor) |
| FCP First Contentful Paint | First visible render — text or image | < 1.8s | 1.8–3.0s | > 3.0s | Diagnostic (render-block indicator) |
Note: LCP’s “good” threshold remains 2.5 seconds. The claim that Google tightened it to 2.0s in a 2026 update has circulated in multiple places but is incorrect per Google’s Search Central documentation, which still documents the 2.5s threshold. Don’t optimize to a ghost standard.
// step 02Triage: The Priority Matrix
With your baseline measurements in hand, you need to prioritize. Not all failing metrics hit equally hard. Not all fixes are equally expensive. This is where most teams lose weeks: treating a 0.12 CLS score with the same urgency as a 5-second LCP.
The matrix tells you where to start: high-impact, low-effort wins first. Caching setup, CDN deployment, LCP preloading, and image format conversion are all in this quadrant. They can be done in hours, not weeks, and they move metrics substantially. Then schedule the harder architectural work — JavaScript refactoring for INP, potentially a hosting migration — for the next sprint. Batch the micro-optimizations like minification and Brotli compression. And be honest about what to defer: a complete CMS migration might be the theoretically correct long-term answer, but it’s not what you do when your LCP is currently 4.8 seconds and you have a site to run.
// step 03Fix the Server First: TTFB Is the Floor
This is the fix almost every guide lists last, under “advanced optimizations.” That’s backwards. TTFB — Time to First Byte — is the absolute floor for your LCP score. It’s the time between when the browser sends a request and when it receives the first byte of the HTML response. Everything else the browser does happens after this.
“TTFB is an LCP floor. If your server is slow to respond, your LCP cannot be fast regardless of how well you have optimized the rest of the page.”
— Chrome team diagnostic guidance, WebVitals.tools synthesis, May 2026
With edge compute now widely available through Vercel Edge Functions, Cloudflare Workers, and AWS Lambda@Edge, a TTFB above 200ms in 2026 is almost always a hosting or architecture decision, not a physical network constraint. There’s no longer a legitimate excuse for most content to answer slowly for most users.
TTFB Diagnostic and Fix Chain
Measure Your Actual TTFB
In Chrome DevTools, open the Network panel, reload the page, and click your HTML document. The “Waiting (TTFB)” time in the Timing tab is your raw server response time. Compare it against the PageSpeed Insights waterfall. Target: under 200ms. Alarm: over 500ms.
Also measure from multiple geographic locations using tools like WebPageTest.org. A site that’s fast for users in the same region as your server but slow globally is a CDN problem, not a server problem.
Implement Server-Side Caching
If you’re running WordPress or any other CMS that generates HTML dynamically on each request, you must implement page caching. A caching plugin (WP Rocket, LiteSpeed Cache, W3 Total Cache) or server-level caching (Nginx FastCGI cache, Varnish) will serve pre-generated HTML instead of executing PHP, querying the database, and assembling the page on every hit.
A properly cached WordPress page can drop from a 1,200ms TTFB to under 80ms without changing anything else. This is not an exaggeration. I’ve seen it on multiple production sites.
; Nginx FastCGI cache configuration (simplified)fastcgi_cache_path /etc/nginx/cache levels=1:2 keys_zone=MYAPP:100m inactive=60m;fastcgi_cache_key "$scheme$request_method$host$request_uri";fastcgi_cache_use_stale error timeout invalid_header updating http_500;add_header X-FastCGI-Cache $upstream_cache_status;
Deploy a CDN for Static Assets (and Edge-Cache HTML Where Possible)
A Content Delivery Network caches your assets at edge nodes geographically close to your users. For purely static or semi-static content, Cloudflare (free tier covers most use cases), Fastly, or BunnyCDN will serve images, CSS, and JavaScript from a node that may be 10–30ms from your user rather than 200ms from a single origin.
For more advanced setups: edge-side rendering with Cloudflare Workers or Vercel Edge Functions moves your entire HTML generation to the edge. Combined with streaming SSR, this is the architectural move that produces LCP scores that are structurally difficult to beat. It’s overkill for a blog, but for a high-traffic ecommerce site it’s increasingly the right call.
// step 04Kill LCP Problems at the Root
Once your TTFB is under control, LCP becomes tractable. The largest contentful paint is almost always one of three elements: a hero image, a large text block rendered via webfont, or a video poster. The strategy differs for each.
LCP Fix Priority List
1. Identify Your Actual LCP Element
Run PageSpeed Insights on your target URL. Under “Diagnostics,” it will show you exactly which element is the LCP candidate with a screenshot. If it’s an image, click through to see the element’s src. If it’s text, you’re dealing with a font loading problem. Don’t guess — confirm the element before you optimize for it.
2. Preload the LCP Resource
This is the single highest-impact, lowest-effort LCP fix. Add a <link rel="preload"> tag in your <head> for the LCP image, telling the browser to start fetching it immediately rather than waiting to discover it during HTML parsing:
<link rel="preload" as="image" href="/images/hero.webp" fetchpriority="high">
If you’re using responsive images with srcset, use the imagesrcset attribute on the preload tag instead. The fetchpriority="high" attribute, now fully supported across all major browsers, ensures the browser assigns it maximum priority over other competing resource fetches.
3. Optimize the LCP Image Itself
If your LCP element is an image, three things kill its load time:
- Format: Serve WebP (or AVIF for even better compression). A 3MB JPEG hero image is often compressible to 200–400KB in WebP at equivalent visual quality. Use
<picture>with AVIF, WebP, and JPEG fallbacks. - Dimensions: Serve the image at the exact rendered size, not 3× larger and scaled down in CSS. A 2400px image displayed at 800px CSS width is carrying 9× the pixels needed.
- Delivery: Serve via your CDN, not your origin server. Every additional round-trip to a distant origin adds latency that compounds with file size.
4. Eliminate Render-Blocking Resources
If your FCP is also slow (check: FCP close to or approaching LCP?), you almost certainly have render-blocking resources. Render-blocking CSS and synchronous scripts in the <head> force the browser to halt parsing and download the resource before it can render anything. The diagnostic chain is: slow FCP → render-block issue → fix before worrying about the LCP element itself.
<!-- WRONG: blocks rendering --><script src="/analytics.js"></script><!-- RIGHT: doesn't block --><script src="/analytics.js" defer></script><!-- or for non-critical scripts: --><script src="/widget.js" async></script>
// step 05Fix INP: The Battle You Didn’t Know You Were Losing
INP is the metric that most teams don’t understand and most tools don’t surface clearly. It’s also, as of 2026, the most commonly failed Core Web Vital — 43% of sites fail the 200ms threshold. And unlike LCP, which you can often fix by compressing an image and adding a preload hint, fixing INP requires confronting how your JavaScript actually runs.
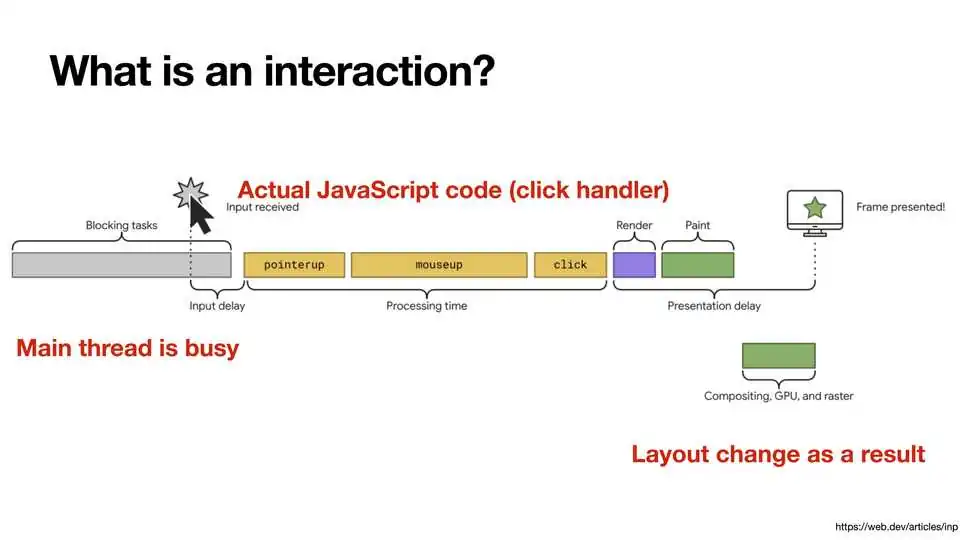
INP (Interaction to Next Paint) measures the latency of the worst interaction during an entire session — not just the first click. Every click, tap, keypress, and form field interaction is measured. The score is the 98th percentile of all interactions. If you have one modal that freezes the page for 600ms when a user opens it, that’s your INP score, regardless of how fast everything else is.
INP replaced FID (First Input Delay) as a Core Web Vital in March 2024. FID only measured the delay before the first interaction. INP measures the worst interaction across the entire session. Any pass-rate data you’re looking at from before March 2024 is measuring a fundamentally easier standard. Don’t let “good FID scores” give you false confidence about INP.
How to Actually Diagnose INP Problems
The Chrome DevTools Performance panel is your only real option here. Record a session that includes typical user interactions — clicking menus, opening accordions, submitting forms. Look for “Long Tasks” (red blocks in the main thread view). Any task over 50ms is contributing to INP latency.
For field data, the Chrome UX Report in Search Console will show you pages with failing INP. But it won’t tell you which interaction is causing it. That’s why real-user monitoring with PerformanceObserver + INP attribution or tools like Sentry, Datadog RUM, or SpeedCurve is invaluable for production diagnosis.
The Three INP Fix Patterns
Fix Pattern 1: Yield to the Main Thread
If you have a long synchronous function that runs on interaction, break it into smaller chunks and yield control back to the browser between them. The modern approach uses scheduler.yield() (now available in Chrome, with a polyfill for Firefox/Safari):
// Long synchronous work — BADfunction processUserClick(data) { step1(data); // 200ms step2(data); // 200ms step3(data); // 200ms // Total: 600ms blocking task}// Yielded work — GOODasync function processUserClick(data) { step1(data); await scheduler.yield(); // hand back control step2(data); await scheduler.yield(); step3(data);} Fix Pattern 2: Code-Split and Defer
The root cause of most INP failures on CMS-powered sites is loading all JavaScript upfront. Analytics scripts, chat widgets, A/B testing libraries — every one of these fires during the page lifecycle and competes for main thread time. Use dynamic imports to load non-critical scripts only when needed:
// Load chat widget only when user interacts with chat buttondocument.getElementById('chat-btn').addEventListener('click', async () => { const { initChat } = await import('/scripts/chat-widget.js'); initChat();}); Fix Pattern 3: Web Workers for Heavy Computation
Genuine computation-heavy operations (JSON parsing of large datasets, image processing, complex filtering) should be moved off the main thread entirely using Web Workers. Web Workers run in a separate thread and can communicate with the main thread via message passing without ever blocking the UI.
// step 06Eliminate CLS: The Sneaky One
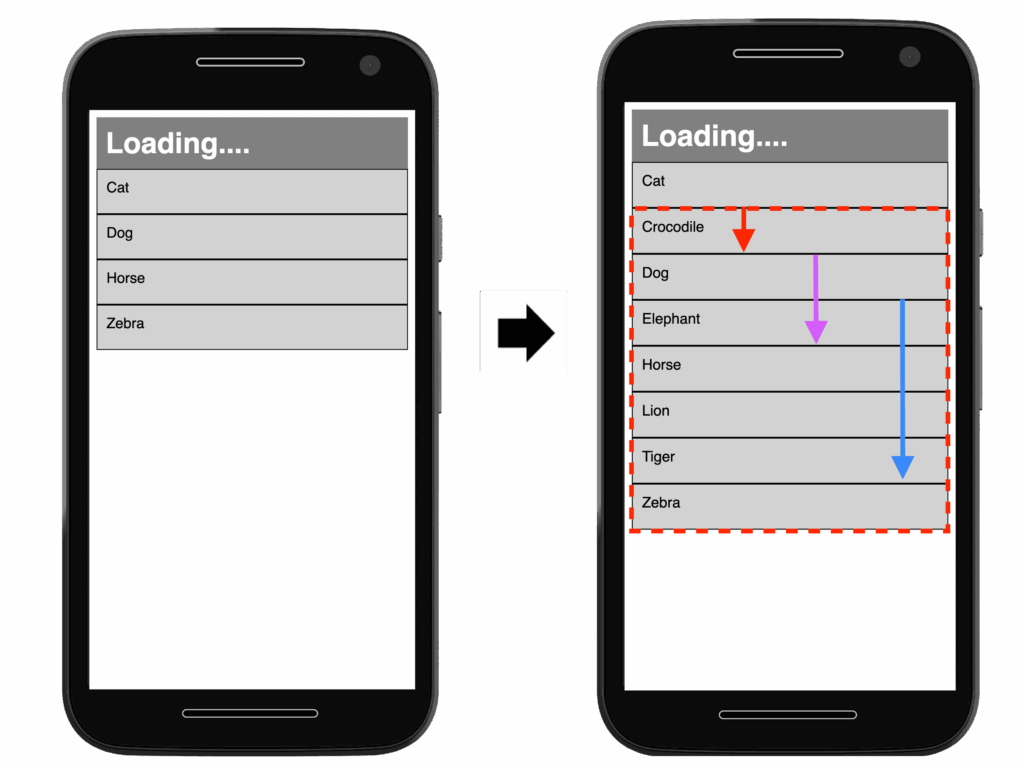
Cumulative Layout Shift is the metric that feels unfair until you understand it. You’ve seen it a thousand times — you’re about to click a link and the page shifts and you tap an ad instead. Or you’re reading an article and the text jumps down suddenly as an image above loads in. That’s CLS. And it’s infuriating in exactly the way that makes users leave and not come back.
CLS is measured as the sum of all unexpected layout shift scores throughout the page lifecycle. Each shift = (fraction of viewport affected) × (distance of shift as fraction of viewport). A good score is under 0.1.
The Four CLS Culprits (in Order of Frequency)
Images Without Dimensions
The most common CLS cause, by a significant margin. If your <img> tags don’t have explicit width and height attributes, the browser doesn’t know how much space to reserve until the image loads. When it loads, everything below it shifts down.
Fix: Always add width and height attributes matching the image’s intrinsic dimensions, then use CSS aspect-ratio for responsive sizing:
<!-- WRONG: causes layout shift --><img src="hero.jpg" style="width:100%"><!-- RIGHT: reserves space before load --><img src="hero.jpg" width="1200" height="630" style="width:100%; height:auto;">
Web Fonts Without Size Adjust
Web fonts that load after the page has already rendered in a fallback font cause layout shifts when the webfont arrives and the text reflows. The modern fix: use font-display: optional (if willing to show fallback on slow connections) or the CSS size-adjust property to make your fallback font match the dimensions of your webfont:
@font-face { font-family: 'MyCustomFont'; src: url('/fonts/mycustomfont.woff2') format('woff2'); font-display: swap;}/* Match fallback dimensions to prevent shift */@font-face { font-family: 'MyCustomFont-Fallback'; src: local('Arial'); ascent-override: 94.5%; descent-override: 24.9%; line-gap-override: 0%; size-adjust: 104%;} Dynamically Injected Content (Ads, Embeds, Banners)
Ad slots that inject above existing content are CLS killers. The fix is reserving space for dynamic content before it loads. If you know a banner will be 90px tall, give its container min-height: 90px before the ad loads. For ad slots where dimensions vary, use aspect-ratio or a min-height based on the most common ad size.
Late-Loading Cookies/GDPR Banners
Cookie consent banners that appear after initial render are a CLS landmine. They either push content down or slide in over content — both cause shifts. Fix: pre-reserve space in your layout for the banner, or use a fixed-position overlay that doesn’t affect document flow.
// step 07Validate, Monitor, and Prevent Regression
Here’s the part nobody writes about: performance degrades naturally over time. A plugin update adds 40KB of JavaScript. A new marketing team member uploads a 4MB banner image. A third-party chat widget starts loading a new tracking pixel. Three months after your optimization sprint, your scores are back to where they started and nobody noticed.
The 28-Day Reality
Google’s CrUX data is based on a 28-day rolling window. This means improvements to your site don’t show up in your Search Console Core Web Vitals report for roughly four to six weeks. Set your team’s expectations accordingly. “We fixed it on Monday, why are our scores still red?” — because they’re measuring the last month, not yesterday.
Your Monitoring Stack
- Google Search Console CWV report: Check monthly at minimum. Set up email alerts for status changes.
- PageSpeed Insights: Run your top 10 URLs monthly. Keep a spreadsheet of scores over time.
- Synthetic monitoring: Tools like SpeedCurve, Calibre, or the open-source Lighthouse CI (integrable into your CI/CD pipeline) run automated performance tests on every deploy. If a code deployment drops your Lighthouse score by 10+ points, it gets flagged before it ships.
- Real User Monitoring: If you have the budget, Sentry Performance, Datadog RUM, or New Relic give you field data with enough granularity to debug specific INP-causing interactions in production.
Performance Budgets: The Discipline That Prevents Regression
Set numeric budgets that automatically fail CI builds if violated:
// lighthouserc.js — CI/CD performance budgetmodule.exports = { ci: { assert: { assertions: { 'largest-contentful-paint': ['error', {maxNumericValue: 2500}], 'cumulative-layout-shift': ['error', {maxNumericValue: 0.1}], 'total-blocking-time': ['error', {maxNumericValue: 300}], 'first-contentful-paint': ['warn', {maxNumericValue: 1800}], } } }}; // quantifiedThe ROI Model: Making the Business Case
I’ve sat in enough rooms where a developer explains Core Web Vitals to a marketing director and watches the director’s eyes glaze over after “Largest Contentful Paint.” You need to speak the language of money. Here is a model that works.
The Three-Variable Revenue Model
This model uses three independently-sourced conversion relationships:
- Conversion rate improvement from speed: A 1-second reduction in page load time → ~7% conversion lift (Akamai). For every 100ms → ~1% (Amazon/Walmart data composite).
- Ranking lift value: Pages in Position 1 vs Position 9 have 10% higher CWV pass rates, suggesting that fixing CWV can lift ranking positions for competitive queries. Each position improvement yields roughly 2-3% additional organic traffic for competitive terms.
- The 28-day CrUX delay: Build this into your projections. Improvements start showing in rankings 4–6 weeks after CrUX data captures them.
| Site Revenue (Annual) | Current Conv. Rate | Avg Load Time Improvement | Est. Conv. Lift | Projected Annual Recovery |
|---|---|---|---|---|
| $500K | 2.1% | 2.0s faster | +14% | ~$35K–50K |
| $2M | 1.8% | 1.5s faster | +10.5% | ~$120K–160K |
| $5M | 2.4% | 2.0s faster | +14% | ~$300K–420K |
| $10M | 1.6% | 1.0s faster | +7% | ~$500K–750K |
These are conservative estimates. They don’t include the compounding effect of ranking improvements (which grow over time as CrUX data accumulates), the reduction in paid traffic costs from improved quality scores on Google Ads (which uses landing page experience as a factor), or the reduction in bounce rates that feeds back into engagement signals. The actual ROI is typically higher.
Vodafone’s 2024 A/B testing study documented a 31% LCP improvement leading to a 15% improvement in lead-to-visit rate, an 11% improvement in cart-to-visit rate, and 8% more sales. Walmart documented that every 1-second improvement in load time increased conversions by 2%. These are not projections — they are measured results from controlled experiments.
// uncomfortable truthThe Problem With How We Measure This
PageSpeed Insights scores are partially theatrical.
I’ve watched teams spend engineering cycles optimizing for a Lighthouse score that barely correlates with their actual field data. PageSpeed Insights simulates load on a throttled mobile device from a single geographic test point. It measures a single page load, not a real user session. It doesn’t capture the third-party scripts that behave differently in real browsers at real load. It doesn’t capture INP at all — because INP requires real user interactions.
A site can score 38 on PageSpeed Insights and still have 85% of its CrUX URLs rated “Good” in Search Console — because real users are on faster connections, have the site cached, and interact with it in ways the simulation doesn’t model. Meanwhile, another site can score 90 on Lighthouse and have terrible INP in the field because a chat widget nobody tested in the lab blocks the main thread for 400ms every time a user opens the nav.
This is not an argument against optimization. It’s an argument for measuring the right thing. Your field data is your business reality. Your Lighthouse score is a diagnostic tool, not a KPI. Optimize for what your real users experience, and use lab scores as a way to identify potential issues — not as the primary measure of success.
This chart carries a critical implication for anyone running or building on WordPress: you’re starting with a structural disadvantage. WordPress’s default configuration — multiple plugins each loading their own JavaScript and CSS, unoptimized themes, shared hosting — consistently underperforms framework-based platforms. The gap between WordPress (46.3%) and Duda (84.9%) is almost entirely architectural. WordPress can match these numbers with careful optimization, but it requires sustained, intentional engineering effort against the platform’s defaults. Know the hill you’re climbing before you start climbing it.
// closingThe Thing That Actually Takes Discipline
I’ve laid out a framework here that, honestly, you could execute in four weeks on most sites. The technical steps aren’t mysterious. The tooling is free or nearly free. The data is available in your Google Search Console right now.
What’s hard is the discipline to do it in the right order. The temptation to reach for image compression first, to celebrate a Lighthouse score improvement before checking field data, to fix INP before fixing a 900ms TTFB — these are the failure modes I see repeatedly. The order isn’t bureaucracy. It’s causality. Downstream problems can’t be solved until upstream ones are cleared.
The other thing that’s hard: keeping it fixed. Performance optimization isn’t a one-time project. It’s a posture. The teams that run consistently fast websites have performance budgets, CI/CD checks, and someone who actually looks at the Search Console CWV report every month. The teams with recurring performance crises have none of those things.
The web is getting faster on average — mobile CWV pass rates climbed from 32% in 2021 to 48% in 2025. But nearly half of all sites still fail all three metrics. In every competitive SERP you care about, there are sites that haven’t done this work. The gap between their performance and yours is a ranking opportunity that exists right now.
Start with your Search Console. Find your worst-performing URLs. Measure TTFB. Fix the server. Then work down the chain.
That’s the framework. The rest is execution.
Sources & Further Reading
- Google Search Central — Core Web Vitals documentation
- web.dev — Interaction to Next Paint (INP)
- 2025 Web Almanac — Performance chapter, HTTP Archive
- DigitalApplied — CWV Benchmarks 2026 (CrUX data)
- Cloudflare — Website Performance and Conversion Rates
- WebPageTest — Multi-location performance testing
- Google Search Console — Core Web Vitals report documentation
- WebVitals.tools — 2026 CWV Update analysis