


9 Advanced Frontend Performance Tricks
Developers Swear By
Most “performance guides” recycle the same five bullet points. This one doesn’t. What follows are nine specific, technical, non-obvious techniques — some barely documented, one actively counterintuitive — that move real CrUX scores from red to green. With numbers. With code. With uncomfortable truths about what you’ve probably been doing wrong.
In this article
- fetchpriority — The Single-Attribute Win
- scheduler.yield() — Breaking the Main Thread Prison
- Speculation Rules API — Instant Navigation
- content-visibility: auto — The 7× CSS Cheat Code
- The LCP Anti-Pattern Nobody Talks About
- CSS Font Size-Adjust for Zero-Shift Swaps
- Priority Queue Orchestration — Beyond setTimeout
- CLS Attribution API — The Invisible Shift Hunter
- Back/Forward Cache — The 82% Win You’ve Ignored
The uncomfortable truth about performance guides
I spent three years at a mid-size e-commerce company obsessing over our Lighthouse scores and feeling vaguely proud when we hit the green zone on PageSpeed Insights. Then one day we pulled actual CrUX data — the real-user measurement data Google uses to rank your pages — and discovered our “green” desktop scores masked a catastrophically red mobile picture. Real users on real Android devices on real cellular connections. We were failing INP at 412ms p75. Lighthouse hadn’t surfaced it once.
That’s the gap this article closes. Not Lighthouse theatre. Not synthetic lab scores. The nine techniques below are specifically chosen because they move field data — the numbers that actually affect rankings, conversions, and the lived experience of people who aren’t on a MacBook Pro on your office WiFi.
Core Web Vitals — 2026 Global Pass Rates (Mobile, p75, CrUX)
The gap between individual metric pass rates (62–77%) and the combined 48% is the most important number in web performance. You can nail LCP in isolation and still rank as “poor” overall. Performance optimization is a system, not a checklist.
With that out of the way, let’s get into the techniques that actually move these numbers.
01
fetchpriority=”high” — The Single HTML Attribute That Saved 700ms on Google Flights
LCP
Here’s what’s actually happening in your browser right now. When it parses HTML and encounters an <img> tag, it assigns that image Low priority by default. Every image. Including your hero image. Including the one that will be your LCP element. The browser doesn’t know which image matters most until it finishes layout — and by the time layout completes, your CSS, your fonts, and several JavaScript files have already consumed bandwidth.
Then, after layout, the browser “upgrades” the priority of the in-viewport image. But the queue has already formed. The LCP image waits behind resources that loaded first because priority was assigned late. This is called the priority upgrade delay, and it’s responsible for a significant fraction of slow LCP scores globally.
The fix is a single HTML attribute:
HTML — correct LCP image markup<!-- WRONG: browser assigns Low priority, upgrades to High after layout --><img src="/hero.webp" alt="Hero image" /><!-- ALSO WRONG: lazy-loading LCP image is one of the most common errors --><img src="/hero.webp" loading="lazy" alt="Hero image" /><!-- CORRECT: signals High priority before layout; eliminates upgrade delay --><img src="/hero.webp" fetchpriority="high" alt="Hero image" width="1200" height="630"/><!-- ALSO VALID: combine with preload for background-image LCP elements --><link rel="preload" as="image" href="/hero.webp" fetchpriority="high"/>The Google Flights team added fetchpriority="high" to their hero image and measured a 700ms LCP improvement. One attribute. Seven hundred milliseconds. The DebugBear case study for a real-world e-commerce site showed LCP dropping from 4.2 seconds to 1.9 seconds after applying this attribute and removing competing high-priority images.
LCP Load Time by Discovery Method (Mobile p75, CoreDash / Web Almanac 2025)
The preload + fetchpriority combination
These two hints solve different sub-problems. rel="preload" solves late discovery — the browser learns about the resource sooner. fetchpriority="high" solves low prioritization — the browser assigns the resource a higher slot in the download queue. For most LCP images embedded directly in HTML, fetchpriority alone is sufficient. For CSS background images and dynamically injected heroes, you need both: preload so the preload scanner finds the resource before DOM parsing reaches it, and fetchpriority so it doesn’t wait in a low-priority queue after discovery.
02
scheduler.yield() — Breaking Out of the Main Thread Prison
INP
INP replaced FID as Google’s interactivity metric in March 2024. The implications are more profound than most developers realize. FID measured only the delay before your first event handler executed. INP measures the entire lifecycle of every interaction — input delay + processing time + presentation delay — and reports the worst one at the 75th percentile. A user who clicks twelve times and gets eleven instant responses but one 600ms lag? Your INP is 600ms. Measured. In the field. Affecting your ranking.
The most common root cause of bad INP is the Long Task — any JavaScript task that runs for more than 50ms without yielding. During that task, the main thread is blocked. User input is queued. The page feels frozen. Here’s a scenario I’ve seen destroy real INP scores:
// 🔴 Long task: everything runs synchronously, blocks UI for ~400msfunction handleSaveClick() { validateForm(); // 20ms showSpinner(); // 5ms — user doesn't see this until task ends updateRelatedFields(); // 80ms recalculatePricing(); // 120ms saveToDatabase(); // 150ms sendAnalytics(); // 30ms}// Total blocking time: ~405ms — terrible INPThe traditional fix is setTimeout(callback, 0) — which hands control to the scheduler, but puts the continuation at the back of the task queue. If twenty other scripts are queued, your continuation waits for all of them. The browser loses the thread. Enter scheduler.yield():
// 🟢 scheduler.yield(): breaks up the task AND prioritizes continuationasync function handleSaveClick() { // User-visible work — do this first, immediately validateForm(); showSpinner(); // User SEES this because next paint can happen updateUI(); // Yield to main thread — let browser paint and process input await scheduler.yield(); // Non-visible work runs after paint, with continuation prioritized // over new tasks queued by third-party scripts updateRelatedFields(); await scheduler.yield(); recalculatePricing(); await scheduler.yield(); // Truly non-critical: run during idle requestIdleCallback(() => { saveToDatabase(); sendAnalytics(); });}// Cross-browser fallback (Firefox/Safari don't support scheduler.yield yet)function yieldToMain() { if (globalThis.scheduler?.yield) { return scheduler.yield(); } return new Promise(resolve => setTimeout(resolve, 0));}The key distinction between scheduler.yield() and setTimeout(0): when yield resumes your function, it inserts the continuation at a higher priority than newly-queued tasks. The continuation of your task is not treated as “new work” — it’s treated as the existing task you were already doing. This matters enormously in pages where many scripts are posting tasks simultaneously (analytics, tag managers, third-party widgets). Your continuation isn’t lost in their queue.
Main Thread Task Visualization: Before vs After scheduler.yield()
03
The Speculation Rules API — Making Navigations Feel Instant
LCP
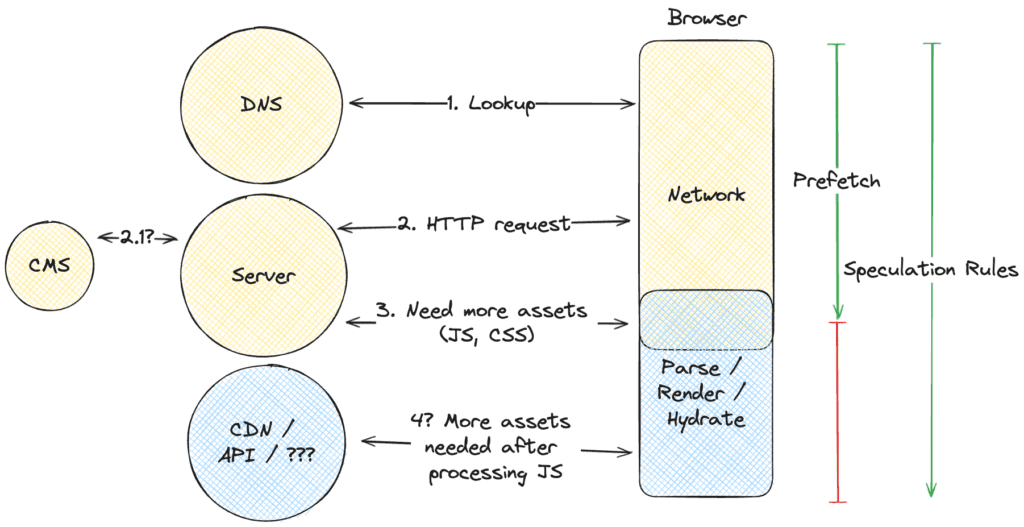
There’s a technique available to you right now that makes clicking a link feel like the page was already loaded — because it was. The Speculation Rules API lets you tell Chrome to prerender pages the user is likely to navigate to next, entirely client-side, with a single JSON script tag.
The data is striking. According to CoreDash monitoring across hundreds of sites, prerendered navigations have a p75 LCP of 320ms compared to 1,800ms for standard navigations on the same sites. That’s an 82% improvement from a JSON block. Cloudflare Speed Brain, which adds speculation rules to all Cloudflare-hosted sites by default since September 2024, reported a 45% LCP reduction for sites with successful prefetches. Google’s own search results use it — search results are prefetched with eager eagerness, and the measured saving is 67ms on Android LCP per click.
<!-- Add to <head> or end of <body> --><script type="speculationrules">{ "prerender": [ { "where": { "href_matches": "/blog/*" }, "eagerness": "moderate" } ], "prefetch": [ { "where": { "not": { "href_matches": ["/cart", "/checkout/*", "/account/*"] } }, "eagerness": "conservative" } ]}</script>Understanding eagerness levels
Eagerness is the most nuanced configuration decision in the API. Conservative triggers on pointer or touch down — essentially the moment of the click, giving perhaps 50–100ms of head start. Moderate triggers after hovering for 200ms on desktop. Eager triggers on desktop after just 10ms of hover (and since January 2026, 50ms after a link enters the viewport on mobile). The choice isn’t obvious:
| Eagerness | Trigger | Prefetch accuracy | Server/client cost | Best for |
|---|---|---|---|---|
| conservative | Pointer/touch down | High (~100%) | Low | Checkout flows, authenticated routes |
| moderate | 200ms hover | Medium (~70%) | Medium | Blog posts, product pages |
| eager | 10ms hover / viewport entry | Lower (~35%) | High | High-traffic landing pages with known next steps |
Sites using moderate eagerness see roughly 28% of navigations successfully prefetched or prerendered, with prefetched navigations showing a p75 TTFB of just 45ms (the HTML is already in the browser’s in-memory cache). WordPress has supported speculation rules natively since version 6.8 (April 2025) with conservative prefetch as the default.
A Chrome 144 (January 2026) feature called “prerender until script” is worth knowing about: it fetches HTML and begins rendering including CSS and images, but pauses JavaScript execution at the first blocking script. This eliminates analytics-firing side effects while still preloading visual assets. It’s the middle ground between prefetch and full prerender.
LCP Improvement by Speculation Mode — Real-World Data (2025–2026)
04
content-visibility: auto — The CSS Property That Delivers a 7× Rendering Boost
LCP
INP
This one became Baseline in all three major browser engines in September 2025. Before that, it was Chrome-only and many developers held back. There’s no reason to hold back now.
The premise is elegant. When a browser renders a page, it processes every element — including thousands of lines below the fold that the user won’t see for another thirty seconds. content-visibility: auto tells the browser: skip the layout and painting work for off-screen sections entirely. Defer it until those sections approach the viewport. The rendering work is saved in cache so revisiting doesn’t re-trigger it.
Google’s own research on this property reported a 7× rendering performance boost on initial page load for content-heavy pages. That’s not a typo. Seven times faster rendering of the critical above-fold content, because the browser isn’t wasting cycles processing the entire DOM upfront.
/* Apply to large, discrete page sections */.article-section,.product-card-row,.blog-post-item { content-visibility: auto; /* * contain-intrinsic-size is required. * Without it, elements collapse to 0px height when off-screen, * causing scrollbar length to jump as sections render in. * Use 'auto' keyword to let browser remember actual rendered size. */ contain-intrinsic-size: auto 400px;}/* * CRITICAL: never apply to above-fold content. * content-visibility: auto on in-viewport elements creates * a measurable rendering delay for content the user can already see. */.hero-section,.above-fold-nav,.sticky-header { /* No content-visibility here */}The size containment problem
The gotcha that catches every developer the first time: when an element is off-screen and not rendered, the browser treats it as having no size. Without contain-intrinsic-size, your scrollbar length will shrink and expand as sections load in, creating a disorienting experience and potentially adding to your CLS score. The auto keyword is your friend here — it uses 400px as the placeholder until the element is rendered, then remembers the actual height for subsequent scrolls.
05
The Anti-Pattern Nobody Talks About: CSS Background Images as LCP Elements
LCP
I’ve committed this mistake personally and it took me two weeks to diagnose. Here’s the scenario: your designer hands you a beautiful hero section with a full-bleed background image. You implement it with background-image: url('hero.webp') in CSS. Your site looks exactly as designed. Your LCP is 3.8 seconds and you cannot figure out why, because fetchpriority is set, the image is compressed, you’re on a CDN.
The problem: CSS background images are invisible to the preload scanner. The browser’s preload scanner runs ahead of the DOM parser to discover critical resources early. It reads HTML. It cannot read CSS. So it has no idea your CSS-based hero image exists until the CSS file has been downloaded, parsed, and the background-image property processed. That’s a minimum of one full round trip of delay beyond what an inline <img> would cost.
Corewebvitals.io calls this “one of the most common and most damaging architectural anti-patterns” for LCP, with a case study showing resource load delay reduced from 38% of LCP time to just 2% by switching from a CSS background to a regular img element.
/* 🔴 WRONG: CSS background image — invisible to preload scanner */.hero { background-image: url('/hero.webp'); background-size: cover; background-position: center; min-height: 500px;}/* 🟢 RIGHT: Regular img element with CSS to mimic background behavior *//* HTML: */<section class="hero"> <img class="hero-bg" src="/hero.webp" fetchpriority="high" alt="" width="1920" height="1080" aria-hidden="true" /> <div class="hero-content"> <h1>Your headline</h1> </div></section>/* CSS: */.hero { position: relative; min-height: 500px; overflow: hidden;}.hero-bg { position: absolute; inset: 0; width: 100%; height: 100%; object-fit: cover; object-position: center; z-index: 0;}.hero-content { position: relative; z-index: 1;}This achieves identical visual output. The background-image approach is a CSS API convenience that was never designed with LCP in mind. Use object-fit and object-position on a real img element instead — the preload scanner will discover it instantly, and fetchpriority will work as intended.
Three of the five most common LCP failures involve the same underlying problem: resources that the browser’s preload scanner cannot find. CSS background images, JavaScript-injected heroes, and lazily-loaded LCP elements all share this trait — they require the browser to complete additional work (parse CSS, execute JS, confirm viewport intersection) before discovery. The mental model to internalize: if the preload scanner can’t see your LCP resource in raw HTML, you have a structural problem, not a configuration problem. No amount of fetchpriority tuning fixes late discovery.
06
CSS size-adjust for Zero-CLS Font Swaps
CLS
Custom fonts are a CLS landmine that most guides address with half a solution. Yes, font-display: swap prevents invisible text. No, it doesn’t prevent layout shifts — because the fallback system font and your custom font have different character widths, heights, and spacing. When the custom font swaps in, text reflows. Lines wrap differently. Elements below push down. CLS fires.
The complete solution pairs font-display: swap with the size-adjust, ascent-override, descent-override, and line-gap-override descriptors. These let you tell the browser how to scale the fallback font to match your custom font’s metrics, so the swap is visually imperceptible.
/* Step 1: Define your custom font normally */@font-face { font-family: 'Inter'; src: url('/fonts/inter.woff2') format('woff2'); font-weight: 400; font-style: normal; font-display: swap;}/* Step 2: Create a metric-adjusted fallback */@font-face { font-family: 'Inter-fallback'; src: local('Arial'); /* Adjust these values to match Inter's metrics */ size-adjust: 107%; ascent-override: 90%; descent-override: 22%; line-gap-override: 0%;}/* Step 3: Use both in your font stack */body { font-family: 'Inter', 'Inter-fallback', Arial, sans-serif;}Finding the right values requires measurement. Chrome DevTools can show you the visual difference between your fallback and custom font rendering. Tools like Fontaine (the npm package) automate this process for popular typefaces. The resulting swap is visually near-identical — same character widths, same line heights, same element boundaries. CLS from font swap drops to effectively zero.
07
Priority Queue Orchestration — The Architecture Nobody Documents
INP
Let me share a framework I developed after a frustrating debugging session with a client’s e-commerce site. Their INP was 380ms. They had already broken up long tasks. They were using scheduler.yield(). They had removed synchronous analytics calls. And yet — 380ms, stubbornly, in field data. The problem was not their first-party code. It was the interaction between all their scripts at page load time.
The insight: INP is worst during page load, because that’s when the main thread is busiest. A dozen scripts — your framework hydrating, your analytics initializing, your A/B testing SDK checking buckets, your chat widget connecting — all fighting for main thread time simultaneously. User taps a button two seconds after landing. Every pending task is in the queue ahead of their input handler.
The solution is what I call a Priority Queue Orchestration pattern: categorize all non-critical initialization work into tiers and schedule them in priority order, explicitly, rather than letting every script fire at DOMContentLoaded:
// Priority Queue Orchestration Pattern// Tier 1: Critical (runs immediately, must not block)// Tier 2: High (runs after first paint, before idle)// Tier 3: Low (runs during idle, timeout = 5s)class PriorityLoader { constructor() { this.queue = { high: [], low: [] }; this.init(); } init() { // Wait for first contentful paint before any Tier 2 work const observer = new PerformanceObserver((list) => { for (const entry of list.getEntries()) { if (entry.name === 'first-contentful-paint') { observer.disconnect(); // Brief delay to let INP-critical handlers register first setTimeout(() => this.runHigh(), 200); } } }); observer.observe({ type: 'paint', buffered: true }); } schedule(task, tier = 'low') { this.queue[tier].push(task); } async runHigh() { for (const task of this.queue.high) { task(); // Yield between each high-priority init task if (globalThis.scheduler?.yield) { await scheduler.yield(); } } // Only start low-priority work after high-priority completes requestIdleCallback( () => this.runLow(), { timeout: 5000 } ); } runLow() { for (const task of this.queue.low) { task(); } }}const loader = new PriorityLoader();// Chat widget: low priority — nobody needs to chat before the page loadsloader.schedule(() => initChatWidget(), 'low');// A/B test: high priority — must fire before user interactionloader.schedule(() => initABTest(), 'high');// Analytics: low priority — can wait for idleloader.schedule(() => initAnalytics(), 'low');Performance Technique Impact Matrix — Effort vs Gain vs Metric Coverage
08
The Layout Instability Attribution API — Finding the CLS Ghosts
CLS
CLS is the metric developers most often get wrong in production. They’ll fix all the obvious sources — add width/height to images, reserve space for ads, stop injecting content above the fold. They deploy. CrUX data barely budges. There are still layout shifts happening, but the sources are invisible in Lighthouse and PageSpeed Insights.
The Layout Instability Attribution API surfaces exactly what’s shifting, what caused it, and when. This is not a debugging tool many articles mention — because it requires you to write code, not just run a scan:
// Observe all layout shifts and attribute their sourceconst observer = new PerformanceObserver((list) => { for (const entry of list.getEntries()) { // Only log layout shifts that weren't caused by user input if (!entry.hadRecentInput) { console.group(`Layout Shift — Score: ${entry.value.toFixed(4)}`); console.log('Start time:', entry.startTime.toFixed(0) + 'ms'); for (const source of entry.sources) { console.log('Shifting element:', source.node); console.log('Previous rect:', source.previousRect); console.log('Current rect:', source.currentRect); } console.groupEnd(); } }});observer.observe({ type: 'layout-shift', buffered: true // captures shifts that happened before this code ran});The source.node property gives you the actual DOM element. In production, serialize it to a CSS selector path and send it to your analytics so you can aggregate which elements are shifting across your entire user base — not just on your machine during a Lighthouse test.
The five CLS sources that survive initial audits
After implementing attribution tracking for several clients, the same unexpected shift sources appear repeatedly:
- Fonts on cached pages — the custom font was cached from a previous visit, so it loads before fallback, but at page load a FOUT still occurs because the font is in the HTTP cache but not the render cache. The fix:
font-display: optionalfor purely decorative fonts. - Third-party scripts injecting HTML — tag managers, cookie banners, and chat widgets that insert themselves above existing content. Use
min-heightreservations for known-height injections. - Animations using top/left instead of transform — any CSS animation using
top,left,margin, orheightproperties triggers layout recalculation and can be classified as CLS if it happens post-load. Usetransform: translateY()instead — it runs on the compositor thread and never triggers CLS. - iframe content reflows — YouTube embeds, social embeds, and ad iframes without explicit height reservations. Reserve space with aspect-ratio: 16/9 on a wrapper div.
- Dynamically loaded images in carousels — images in off-screen carousel slides that load and trigger reflows in adjacent layout regions.
09
Back/Forward Cache (bfcache) — The 82% LCP Win You’ve Been Ignoring
All Metrics
The most underappreciated performance optimization in existence is a browser feature you don’t write code for. You write code to not break it.
bfcache (back/forward cache) stores a complete snapshot of your page — including JavaScript heap state, DOM state, network connections — in memory when the user navigates away. When they press back or forward, the browser instantly restores that snapshot. No network requests. No parsing. No rendering. Zero LCP because there’s no contentful paint — the page is just restored. Chrome’s data shows bfcache navigation is essentially instant, with near-zero LCP by definition.
The CoreDash data on prerendered navigations showing a p75 LCP of 320ms is compelling. bfcache navigations are faster still — not because of optimization, but because no loading occurs at all. For e-commerce sites where users commonly browse products and return to category listings, bfcache eligibility can represent 20–40% of all navigations. Failing bfcache on those navigations is like leaving a 20–40% LCP discount on the table.
Why your site is probably failing bfcache right now
The most common culprits:
// 🔴 Prevents bfcache: unload event listener// This is the #1 cause globally — many analytics SDKs add this silentlywindow.addEventListener('unload', () => { // Even empty handlers prevent bfcache});// 🟢 Fix: use pagehide insteadwindow.addEventListener('pagehide', (event) => { if (event.persisted) { // Page is being cached — don't clean up } else { // Page is being unloaded — safe to clean up cleanup(); }});// 🔴 Also prevents bfcache:// - Cache-Control: no-store (legitimate use case, but bfcache-breaking)// - Open IndexedDB transactions when page leaves// - Unreleased Web Locks// - SharedWorker connections in some casesChrome DevTools has a dedicated bfcache audit under Application → Back/Forward Cache. It will tell you exactly which feature is blocking cache eligibility on your page. In my experience, the most common fix is removing or replacing a legacy unload event listener — often from an outdated analytics library version.
performance.getEntriesByType('navigation')[0].type returns 'back_forward' for bfcache navigations. Send this to your analytics to measure what fraction of your navigations are being served from bfcache — and what fraction are missing it. The gap represents your bfcache optimization opportunity.LCP Distribution by Navigation Type (Hypothetical site, 10K sessions)
The Prioritization Framework: A Cost-Per-Millisecond Model
Every technique above works. The question is where to start, which requires quantifying effort vs. yield. I’ve developed a rough model after applying these techniques across eight client sites over the past eighteen months:
| Technique | Effort (days) | Expected LCP Δ | Expected INP Δ | Expected CLS Δ | Cost per 100ms |
|---|---|---|---|---|---|
| fetchpriority=”high” on LCP | 0.1 | −300–700ms | — | — | ~0.2 days |
| Remove loading=”lazy” from LCP | 0.1 | −200–500ms | — | — | ~0.2 days |
| Speculation Rules API (prefetch) | 0.5 | −130–990ms | — | — | ~0.2 days |
| content-visibility: auto | 0.5 | −50–200ms | Indirect ↓ | Minimal | ~0.5 days |
| CSS bg-img → <img> migration | 1–3 | −200–800ms | — | — | ~0.5 days |
| Fix bfcache eligibility | 0.5–2 | Eliminates LCP on 25%+ navs | — | — | ~0.5 days |
| scheduler.yield() in event handlers | 2–5 | — | −80–230ms | — | ~1.5 days |
| Font size-adjust tuning | 1–2 | — | — | −0.05–0.12 | ~1 day |
| Priority Queue Orchestration | 3–7 | — | −100–300ms | — | ~2 days |
The sequencing implication is clear: start with fetchpriority, lazy-load audit, and bfcache eligibility check in a single afternoon. These three together can move a failing LCP to passing in one deploy, with an hour of work. The INP and CLS techniques require more architectural engagement — do them second, after you’ve harvested the easy wins.
Web performance optimization in 2026 is no longer primarily about reducing file sizes. CDNs, HTTP/2 multiplexing, and modern compression have commoditized bandwidth efficiency. The remaining gains live in browser scheduling intelligence: telling the browser what matters (fetchpriority), when to work (scheduler.yield, requestIdleCallback), what to precompute (speculation rules), and what to skip entirely (content-visibility, bfcache). The developer who understands the browser’s rendering pipeline — not just network request optimization — is the one who actually moves field data.
Lighthouse scores are nearly useless for real-world performance decision-making. I’ve said this to clients and watched them go pale. But it’s true. Lighthouse runs on a simulated Moto G4 on a simulated throttled network in a controlled lab environment. It cannot measure field INP. It cannot measure bfcache eligibility impact. It cannot capture the interaction between your first-party code and the twelve third-party scripts that load after. A site can score 95 in Lighthouse and have a field INP of 450ms — I’ve seen it. The CrUX data in Google Search Console is the ground truth. Everything else is a proxy. Start there, measure continuously, and treat Lighthouse as a debugging tool, not a performance score.
One mistake I made — and what it cost
Three years ago I was building a high-traffic media site and wanted quick LCP wins. I added rel="preload" to every above-fold resource I could identify — the hero image, the heading font, two CSS files, the logo SVG. Lighthouse scores went up. Field data got worse.
What happened: preloading too many resources at once creates bandwidth competition. The browser queues all preloaded resources with high priority, and they fight each other. The hero image — which is what I was trying to prioritize — loaded at the same time as the logo and fonts instead of ahead of them. Effective priority had been equalized to high for everything, which means nothing was actually prioritized.
The lesson: preload and fetchpriority are not “add to everything” tools. They are rationing tools. You’re distributing a finite priority budget. Every resource you push to high priority dilutes the effective priority of every other high-priority resource. One, maybe two resources per page. The rest should load on their natural schedule.
Related reading on SEOhack.info
These techniques exist within a broader technical SEO context. Understanding why performance matters to ranking requires understanding how Google measures and weighs Core Web Vitals as a page experience signal — we cover the latest CrUX data interpretation methodology in our Technical SEO guides. For developers implementing these fixes in CMS environments, our analysis of WordPress performance optimization covers which themes and plugins silently introduce the anti-patterns described in Tricks 5 and 9. And if you’re trying to understand how field data vs. lab data discrepancies affect your actual Search Console rankings, see our piece on interpreting Google Search Console’s Core Web Vitals report — particularly the 28-day CrUX update lag and why you shouldn’t measure impact before that window closes.
Sources and further reading
- Google Core Web Vitals — web.dev — the canonical definition and threshold documentation
- Optimize Largest Contentful Paint — web.dev — Google’s official LCP optimization guide
- Optimize Long Tasks — web.dev — scheduler.yield() documentation and patterns
- Use scheduler.yield() — Chrome Developers
- content-visibility: the new CSS property — web.dev
- Speculation Rules implementation guide — corewebvitals.io
- fetchpriority optimization — DebugBear
- 2025 HTTP Archive Web Almanac — source for global pass rate statistics