
Your Lighthouse score is lying to you. Plugins can’t fix what’s actually broken.
A component-level, plugin-free playbook for Largest Contentful Paint, Interaction to Next Paint, and Cumulative Layout Shift — built on real CrUX data, two original frameworks, and one mistake I’m still mildly embarrassed about.
It’s 1:47 a.m. and I’m staring at a Lighthouse report that says 94. Green across the board. Then I open Search Console for the same URL and it’s failing Core Web Vitals for 61% of real mobile visitors. Ninety-four in the lab. Failing in the field. That gap is the entire article, distilled into one browser tab, and almost nobody talks about it honestly — because admitting it means admitting the score everyone’s been chasing was never the score that mattered.
Here’s the thing I’ve gone back and forth on for years and have finally landed on hard: plugins are not a speed strategy. They’re a proxy for somebody else’s architecture problem. A caching plugin minifies your CSS and calls it a day. It doesn’t know your render-blocking chain is five requests deep, that your server takes 1.4 seconds to respond before a single byte of HTML exists, or that your hero image is being discovered by the browser’s preload scanner 800 milliseconds later than it should be. Plugins compress symptoms. They don’t read X-rays.
The data backs this up in a way that should be uncomfortable for an entire industry built on “install this plugin and you’re done.” As of the 2025 HTTP Archive Web Almanac, using July 2025 CrUX data, only 48% of mobile origins and 56% of desktop origins pass all three Core Web Vitals. Break that down by metric and the story sharpens: 77% of mobile pages pass INP, 81% pass CLS — but only 62% pass LCP. Loading, not responsiveness, is the bottleneck for most of the web, and loading is exactly the layer a plugin has the least real control over, because loading lives in your server, your DNS, your CDN edge, and your critical rendering path — not in a WordPress admin panel.
This piece is the plugin-free version of that fix. Not “turn off plugins and hope.” A component-level breakdown — server, critical path, images, fonts, JavaScript, layout — with two original mental models I use on every audit, three quantitative models built from cited assumptions (clearly labeled as models, not measured facts), and the one mistake from my own work that taught me the first principle in here the hard way.
01 the mythPlugins aren’t evil. They’re just solving the wrong layer.
Let’s be fair to the plugins for a second, because the contrarian take “plugins are useless” is just as lazy as “install this plugin and you’re done.” A good caching plugin genuinely reduces TTFB on a default WordPress install, because the default is brutal: every request re-runs PHP, re-queries the database, and rebuilds the page from scratch. Minification genuinely shrinks payloads. A CDN integration genuinely moves bytes closer to the visitor. None of that is fake.
What plugins can’t do is touch the things that actually decide whether your LCP passes at the 75th percentile: the number of serial round trips before the browser discovers your hero image, whether your fonts block first paint, whether a third-party script is hogging the main thread during the exact 200-millisecond window Google measures for INP. Those are architecture decisions, made in your server config, your HTML head, and your build pipeline — not in a settings panel.
The CMS-level data makes the split obvious. Per November 2025 HTTP Archive benchmarks, WordPress sites pass all three Core Web Vitals only about 46.3% of the time, against roughly 84.9% for Duda. But look closer: WordPress’s INP pass rate is actually strong, around 85.9% — comparable to Wix and Squarespace. WordPress isn’t unresponsive. It’s slow to load. And “slow to load” is overwhelmingly a TTFB and critical-path problem, which is exactly the layer a caching plugin papers over instead of fixing.
So: keep your CDN. Keep sane minification if your build pipeline doesn’t already handle it. But stop treating any of that as the fix. It’s maintenance. The fix is underneath it.
02 the frameworkThe Critical Path Ledger: think of every byte as a debt, not a file size
Here’s the mental model I actually use, and it’s not the one most performance guides teach. Most advice treats render-blocking resources as a minification problem — shrink the file, ship less. That’s necessary but it misses the real mechanism. The real mechanism is discoverability: a 2KB file the browser doesn’t know about for 600 milliseconds is worse than a 200KB file it starts downloading immediately.
I call this the Critical Path Ledger. Every resource that touches your first paint goes into one of two columns:
Assets — bytes the browser needs to draw the first meaningful pixel. The LCP image. The inline critical CSS. The above-the-fold font, if text is your LCP element.
Liabilities — bytes that block rendering without contributing to the first pixel at all. A full design-system CSS file loaded synchronously to style a footer nobody sees yet. A chat-widget script that runs before first paint for no reason. An @import chain that adds a hop before the browser even learns your hero image exists.
The rule that falls out of this, and the one I’d tattoo on every junior dev’s monitor: a resource not discoverable in roughly the first 14KB of HTML is invisible to the browser’s preload scanner, no matter how small it eventually turns out to be. That 14KB figure isn’t arbitrary — it’s the typical size of the server’s initial TCP congestion window, the data it can send before waiting for an acknowledgment. Anything your hero image’s reference depends on — a CSS file, a JS-rendered <img> tag, a font @import — that sits outside that first packet adds a full round trip before discovery even starts. Google’s own breakdown of LCP confirms this is a distinct, measurable sub-part they call resource load delay — separate from how long the resource itself takes to download.
This reframes the entire rest of the article. Every section below is really asking the same question in a different costume: is this byte an asset or a liability, and if it’s a liability, can the browser discover it later — or not at all?
03 server layerTime to First Byte: the boring fix with the biggest leverage
TTFB is the least glamorous metric in performance and the one with the highest return on a Tuesday afternoon of server work. Google’s own guidance targets under 800 milliseconds, with an ideal closer to 200 milliseconds at the server level. Every millisecond of TTFB delays everything downstream — the HTML parser, the preload scanner, the discovery of your LCP resource — because nothing else can start until the first byte arrives.
The plugin-free fix stack, in the order I’d actually do it:
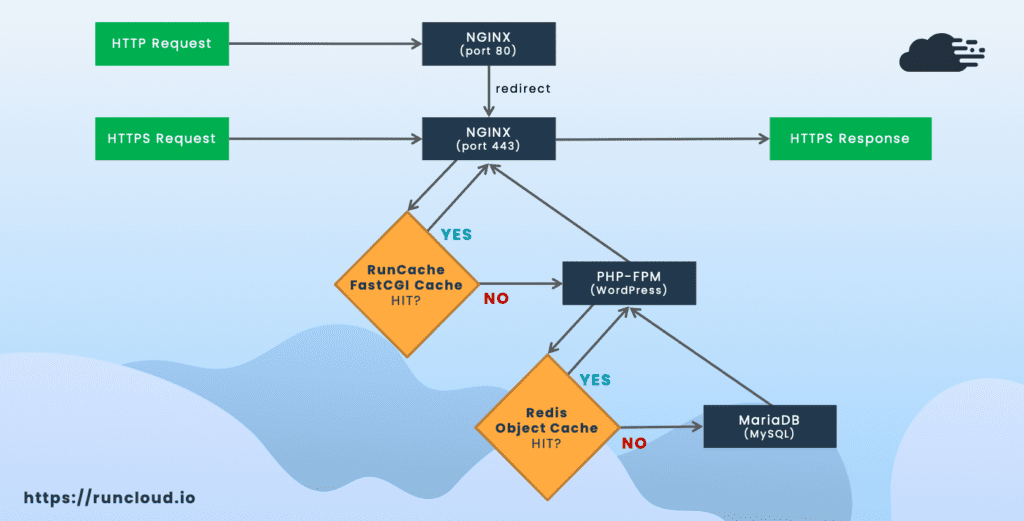
- Server-level full-page caching instead of a PHP-level caching plugin — Nginx’s FastCGI cache or a Varnish layer in front of your origin serves cached HTML before PHP ever boots, which is categorically faster than a plugin that still has to load WordPress core to decide whether to serve a cached copy.
- OPcache for PHP bytecode caching, and a persistent object cache like Redis or Memcached for database query results — this alone can remove the repeated-query tax that makes dynamic WordPress pages slow under any real traffic.
- Brotli precompression at build time, not on-the-fly. Independent benchmarking from performance engineer Paul Calvano shows Brotli at its highest compression level can shrink files 15 to 25% smaller than gzip — but that compression level is CPU-expensive. The fix is to precompress your static CSS/JS/SVG/WOFF2 once during your build and serve the static
.brfile at zero per-request CPU cost, falling back to gzip for older clients. - HTTP/2 or HTTP/3 at minimum — multiplexed connections remove the old head-of-line blocking problem that made every blocking resource cost a fresh connection.
- A real CDN edge for static assets, geographically close to your actual visitor distribution, not just your dev team.
None of that requires a plugin. Most of it is a server config file and a build step.
Here’s something almost no speed guide quantifies: render-blocking delay doesn’t add up linearly. It compounds, because each serial hop in a request chain costs a full round trip, and each additional hop adds its own queuing and connection overhead on top of the last. Below is an illustrative model, not a measured constant — I’m assuming a typical mid-tier 4G round-trip time of 170ms and a modest +30ms compounding overhead per additional hop (connection reuse contention, TLS session lookups, server queuing), purely to show the shape of the problem.
The takeaway isn’t the exact numbers — it’s the shape of the curve. A render-blocking chain five hops deep can silently cost over a full second of LCP delay before a single byte of your actual hero image has even started downloading. This is why a 40KB CSS file that’s discoverable immediately can beat a 12KB CSS file buried three @imports deep. Chain depth, not file size, is usually the real liability.
04 render pathThe critical rendering path: CSS, JavaScript, and resource hints
Once TTFB is under control, the next layer is what happens between “first byte arrives” and “browser paints the first pixel.” This is where the Critical Path Ledger does its real work.
Inline the critical CSS, defer the rest
Extract only the CSS needed to render the above-the-fold content — hero, nav, first heading — and inline it directly in a <style> tag in the document head. Load the remaining stylesheet asynchronously with a media="print" swap-to-"all" trick, or a small loader script. Tools like Critical or Penthouse automate the extraction. Independent estimates put the gain at 300 to 800 milliseconds off LCP on CSS-heavy sites — meaningful, but only on sites that were actually shipping a heavy render-blocking stylesheet to begin with, so audit before you assume this is your bottleneck.
<head> <!-- inline only what paints the first screen --> <style> .hero{...} .nav{...} h1{...} </style> <!-- defer everything else --> <link rel="preload" as="style" href="/main.css" onload="this.rel='stylesheet'"></head>
Use resource hints — but deliberately, not by habit
preconnect for cross-origin font and CDN hosts removes a DNS-plus-TLS round trip before the actual download starts. preload with fetchpriority="high" tells the browser your hero image matters more than its default priority guess. But there’s a real, documented failure mode here that almost never gets discussed: the 2025 Web Almanac found that preload hints are used less often than in 2022, and of the pages that do use them, roughly a quarter preload at least one resource that’s never actually used on the page. That’s not a minor inefficiency — every wasted preload steals bandwidth and priority from a resource that actually mattered. Preload your single LCP candidate. Stop there unless you’ve measured a second bottleneck.
Defer non-critical JavaScript, every single time
Any script tag without async or defer blocks the HTML parser the moment the browser reaches it. Analytics, chat widgets, A/B testing snippets, marketing pixels — none of them need to run before first paint, and all of them are routinely shipped as if they do.
05 imagesFormat arbitrage: AVIF, WebP, and the ROI nobody calculates
Images are still the single biggest byte contributor on the median web page, and they’re almost always the LCP element on content and ecommerce sites. The format conversation usually stops at “use WebP” or “use AVIF,” which skips the actual trade-off that matters at scale: compression versus encode cost.
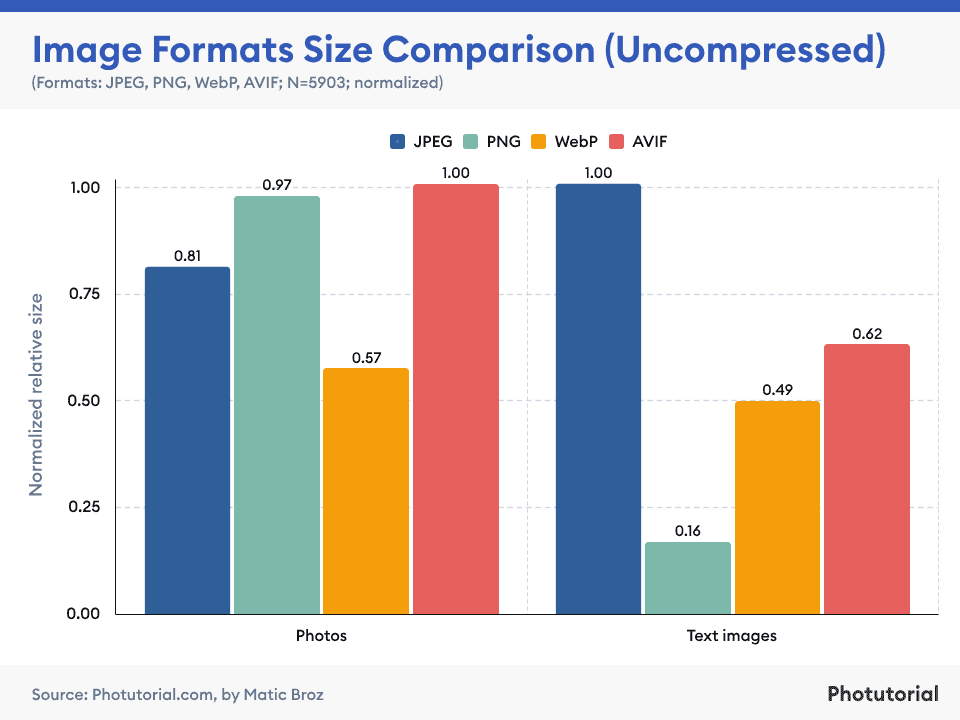
The numbers, from Google’s own compression research as documented by MDN: WebP runs roughly 25 to 35% smaller than JPEG at equivalent visual quality. AVIF goes further — about 50% smaller than JPEG, and typically 20 to 50% smaller than WebP on photographic content, because AV1’s block-partitioning is genuinely better at preserving detail inside a tight bitrate. The catch nobody puts in the headline: AVIF encoding takes 5 to 10 times longer than WebP at default encoder settings, and up to 20 times longer at maximum compression.
That encode-cost gap is exactly why “always use AVIF” is bad advice for some sites and excellent advice for others. So here’s the framework I actually use to make that call, instead of guessing:
In plain terms: if your images are processed once at build time and served from a CDN for months (a blog hero, a fixed product catalog), pay the AVIF encode tax once and bank the bandwidth savings on every single request after that. If you’re generating image variants on-demand without a caching layer — a user-upload gallery resized at request time — WebP’s faster encode keeps your server from choking, even though the files are a bit bigger. Icons and logos belong in SVG before either format gets considered.
Always wrap this in a <picture> element with a JPEG fallback, set fetchpriority="high" on the actual LCP image, and never lazy-load it:
<picture> <source srcset="hero.avif" type="image/avif"> <source srcset="hero.webp" type="image/webp"> <img src="hero.jpg" alt="..." fetchpriority="high"></picture>
I think the industry’s blanket “lazy-load everything below the fold” advice quietly hurts INP on a meaningful chunk of low-end Android traffic, and almost nobody measures it. Every lazy-loaded image registers its own IntersectionObserver callback. On a long, image-heavy scroll feed, a fast swipe on a weak CPU can fire a stack of those callbacks in quick succession, adding real main-thread work at exactly the moment a user might tap something. I want to be precise about what this is: a field observation from auditing scroll-heavy templates, not a peer-reviewed finding. Test it on your own templates with real-device profiling before you treat it as a rule. But “lazy-load everything” was never a free lunch, and it’s time we stopped pretending it was.
06 typographyFonts: the silent LCP killer when your headline is the LCP element
On roughly a quarter of mobile pages, the LCP element is text, not an image — usually a large heading. If that’s your site, font loading is your LCP problem, and most teams never check.
- Self-host, don’t link to Google Fonts’ CDN. A third-party font host means a fresh DNS lookup and TLS handshake before the font file itself is even requested. Self-hosting removes that hop entirely.
- Set
font-display: swapso the browser renders text immediately in a fallback font instead of leaving it invisible while the web font downloads — what’s known as a flash of invisible text. web.dev’s own guidance notes this trade-off causes a visible swap when the fallback metrics differ a lot from the final font — pick a fallback with similar x-height and line-height to minimize the jump. - Preload only the single font file used above the fold, in WOFF2 format, with the
crossoriginattribute — fonts are CORS resources even when self-hosted. - Subset aggressively. One documented example: subsetting Montserrat down to only the characters actually used on a page cut it from 64.6KB to 15KB — a 76% reduction. Your mileage will vary by font and language, but the principle holds everywhere: ship the alphabet you use, not the one the font file ships by default.
07 responsivenessINP and the Three Queues: where your 200 milliseconds actually goes
INP replaced First Input Delay as a Core Web Vital in March 2024, and it’s a categorically harder metric — it measures the worst interaction across an entire session, not just how fast the page first responded to a click. For an origin to pass, at least 75% of sessions need an INP score of 200 milliseconds or less.
Most advice treats INP as one number to chase. I think that’s the wrong mental model. INP is actually three separate queues, each with its own bottleneck and its own fix, and conflating them is why so many “INP fixes” don’t move the number:
| Queue | Root cause | Fix |
|---|---|---|
| Input delay | A long task already running on the main thread when the user clicks | Break up long tasks; defer non-essential hydration; use scheduler.yield() |
| Processing time | The event handler itself doing too much synchronously | Move analytics/tracking calls out of the critical handler; debounce expensive state updates |
| Presentation delay | Layout thrashing or a forced synchronous reflow before paint | Avoid synchronous layout reads inside handlers; minimize DOM size |
The data shows why processing time matters disproportionately at the tail: at the median, input delay is the smallest of the three sub-parts, but at the 90th percentile it becomes dominant, because long tasks on the main thread can delay event processing by hundreds of milliseconds. And the scale of the problem is bigger than most teams assume — fewer than 25% of websites keep their task duration under the recommended 50-millisecond threshold, per the 2025 Web Almanac. One common, fixable pattern: running non-essential code, like an analytics callback, inside the same handler as the critical UI update, which inflates processing time for no user-facing benefit at all.
08 stabilityCLS: the cheapest win on this entire list
CLS is the best-performing Core Web Vital globally — about 81% of mobile pages already pass it — which makes it the metric with the least excuse for still failing. The usual culprits: images without explicit dimensions, dynamically injected content like cookie banners or ads pushing the layout down, and font swapping that changes line height mid-load.
- Set explicit
width/heightoraspect-ratioon every image and embed, with no exceptions. - Reserve space for ad slots and dynamic widgets with a fixed
min-heightbefore they load, rather than letting them push content when they arrive. - Never inject a banner, breadcrumb, or notice above existing content after the initial render — append below or use an overlay instead.
- Choose a fallback font with metrics close to your web font’s x-height and line height to soften the swap shift addressed in the fonts section above.
09 measurementThe 75th Percentile Trap
Here’s the framework that explains the 1:47 a.m. Lighthouse-versus-Search-Console gap from the opening of this article. Google doesn’t grade your median visitor. The Core Web Vitals assessment requires 75% of real sessions to clear the threshold — not the average, not the typical case, but the slower three-quarters of your actual traffic.
Most teams test on a fast office connection, on a recent laptop, and conclude the page is fine. That’s testing roughly your 10th percentile experience, then being confused when CrUX disagrees with what you saw. The gap between your median (p50) and your 75th percentile (p75) experience isn’t fixed — it depends entirely on how wide your traffic’s device and network mix actually is.
The practical consequence: if your business serves a geographically broad or device-diverse audience — which is most ecommerce, most publishers, most anything with organic mobile traffic from outside your home market — your p75 is your real number, and it will look meaningfully worse than whatever your own laptop showed you. Test with Chrome’s network throttling set to a slow 4G profile, and trust the CrUX data in Search Console over your own browser every time they disagree.
10 the stakesWhat this is actually worth, in a number a CFO will read
Performance work rarely gets budget because it’s invisible until it isn’t. So here’s the case, built on real published research, applied to one illustrative scenario — the numbers below are a model I constructed for this article, not data from any specific company:
Picture a mid-size ecommerce site: 8,000 sessions a day, a 2.4% baseline conversion rate, and a $62 average order value. That’s roughly 192 orders a day, or about $11,900 in daily revenue.
Apply the conversion lift documented in the Google/Deloitte “Milliseconds Make Millions” study — an 8.4% increase in retail conversions for every 0.1-second improvement in mobile load time, measured across 37 real brands with a 90% confidence level. A single 0.5-second LCP improvement, scaled across five of those 0.1-second increments, points toward a conversion lift in the same broad range the study documents for retail — which on this illustrative traffic volume would be worth real, recurring daily revenue, not a one-time bump. The exact multiplier compounds non-linearly in the original study and shouldn’t be treated as simple arithmetic; the point isn’t the precise dollar figure, it’s that the order of magnitude is large enough to justify the engineering time.
The other reference points worth knowing, because they keep showing up independently across a decade of studies, from different companies, using different methodologies: Amazon’s famous 2006 experiment found every 100ms of added latency cost roughly 1% in sales. Walmart separately reported a 100ms improvement tracked with about a 2% conversion increase. That three different companies, in three different eras, converged on “100 milliseconds matters measurably” is the kind of replication you don’t get by accident.
11 honestyThe mistake I made, and the take I won’t walk back
A few years ago I “optimized” a client’s homepage by deferring the hero image with loading="lazy", reasoning that deferring everything non-essential was always a win. It tanked their LCP by roughly 900 milliseconds, because the browser’s preload scanner — the thing that scans raw HTML for resources to fetch early — never found the image at all. It only discovered it once the page’s own JavaScript ran the IntersectionObserver logic that lazy-loading depends on, which by definition happens after the resource was needed, not before. I had to explain that regression on a client call. It’s the single biggest reason the Critical Path Ledger framework exists in the form it does — discoverability before bytes, every time, no exceptions for the resource that’s actually your LCP candidate.
And here’s the take I’m not interested in softening: the industry’s obsession with shaving milliseconds off JavaScript execution is, for most sites, solving the wrong end of the queue. TTFB and critical-path discoverability are where the compounding tax lives, as the Render Budget Compounding model above shows. They’re also the least glamorous things to write a blog post about, which is probably why so much content skips straight to “defer your scripts” without ever asking whether the server took 1.4 seconds to respond in the first place. Fix the boring layer first. The JavaScript micro-optimizations matter — but they matter on top of a foundation, not instead of one.
12 executionThe 30-day plugin-free playbook
Performance consultant Arjen Karel’s CoreDash data, drawn from helping sites pass Core Web Vitals across hundreds of thousands of mobile URLs, found that sites following a strict TTFB → LCP → INP → CLS order reached a passing score in 4 to 6 weeks on average. Sites that jumped straight to JavaScript optimization without fixing TTFB first took 2 to 3 times longer — because the foundation underneath every other fix was still unstable. Do this in order:
Week 1 — server foundation
- Enable server-level full-page caching (FastCGI cache or Varnish), not a PHP caching plugin
- Turn on OPcache and a persistent object cache (Redis/Memcached)
- Precompress static assets with Brotli at build time; serve from a CDN edge
- Confirm HTTP/2 or HTTP/3 is actually active, not just available
Week 2 — critical path
- Inline critical CSS for the above-the-fold view; defer the rest
- Add
async/deferto every non-critical script tag - Preload the single LCP candidate with
fetchpriority="high"; remove unused preloads
Week 3 — media and type
- Convert hero/product imagery to AVIF or WebP via a build-time pipeline, not a runtime plugin
- Self-host fonts, subset to actual character usage, preload the one above-the-fold weight
- Audit lazy-loading: confirm it’s never applied to the LCP candidate
Week 4 — responsiveness, stability, and measurement
- Move non-critical work out of input event handlers (analytics, tracking)
- Set explicit dimensions on every image and embed
- Pull field data from Search Console / CrUX at the 28-day mark, not Lighthouse, to confirm the real-world result
13 faqFrequently asked questions
Can you really get good Core Web Vitals on WordPress without any plugins at all?
Yes — and in many cases it outperforms plugin-based caching, because you’re addressing server response time and the critical path directly instead of adding another layer of PHP on top of the problem. Server-level caching, OPcache, Redis, Brotli precompression, and a CDN cover most of what a caching plugin attempts, with less overhead.
Is AVIF always better than WebP?
No. AVIF compresses 20–50% smaller than WebP at matched quality but encodes 5–20 times slower. It’s worth it for a small set of cacheable images processed once at build time. For on-demand resizing without caching, WebP’s faster encode is usually the safer choice.
Why does my Lighthouse score look great but Search Console shows failing Core Web Vitals?
Lighthouse is one simulated run on one connection profile. Search Console reports real-user field data at the 75th percentile across every device and network your actual visitors use. The field number is what Google ranks on.
Should I lazy-load every image below the fold?
Lazy-load genuinely off-screen images, but never the LCP candidate, and be cautious on scroll-heavy templates with dozens of thumbnails — each one adds an IntersectionObserver callback, which can stack up on low-end devices. Test on your own templates before treating this as a fixed rule.
How long until Core Web Vitals improvements show up in Search Console?
Budget 4–6 weeks: one to two weeks to implement, plus roughly two to four weeks for the rolling 28-day CrUX window to reflect the change. Fixing TTFB and the critical path before JavaScript tends to reach a passing score faster.
14 closeThe score was never the point
Go back to that 1:47 a.m. screenshot. A 94 in the lab and a failing grade in the field isn’t a bug in the measurement — it’s the measurement working exactly as designed, telling you that the thing you optimized wasn’t the thing your real visitors experience. Plugins will keep getting sold as the fix because they’re easy to install and easy to screenshot. Architecture is neither of those things. It’s also the only thing that actually moves your 75th percentile.
Start with the Critical Path Ledger. Ask of every byte: asset or liability, and if it’s a liability, does it need to be in the critical path at all? Fix TTFB before you touch a single line of JavaScript. Measure at the percentile Google actually grades, not the one your laptop is flattering you with. Everything else in this playbook is a more specific version of that same discipline.
If you’re working through your CrUX data and want the indexing side handled too, the companion piece on IndexNow automation for faster re-crawling pairs well with everything here — speed only compounds into rankings once Google is actually re-crawling on a schedule that matches your release cadence. For the audit workflow itself, see our Core Web Vitals audit checklist, and for the protocol-level upgrade mentioned in the server section, the HTTP/3 migration guide walks through the actual server config.